In one sentence showing RS means outperforming other stocks both during market uptrends and downtrends.
What is Relative Strength (RS) and how to identify it (Thread)
In one sentence showing RS means outperforming other stocks both during market uptrends and downtrends.
If you want to outperform the indexes, logic says you have to be invested in stocks doing the same.
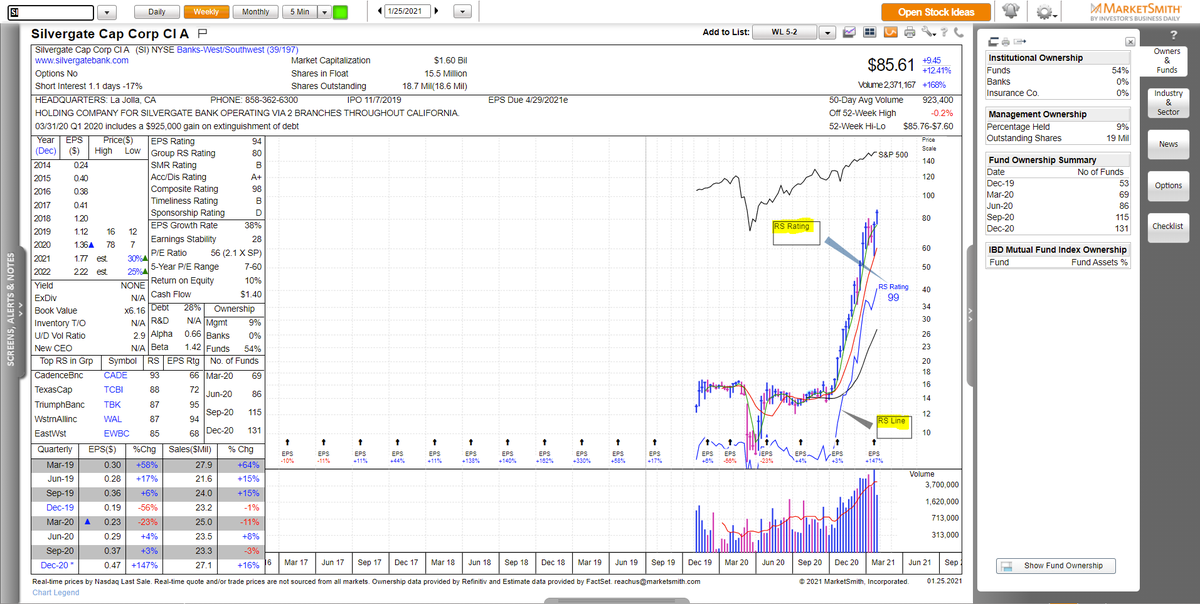
RS Rating: @IBDinvestors Proprietary measure of RS scored 1-99. Stocks with an RS rating of 80 have outperformed 80% of stocks over the past year.
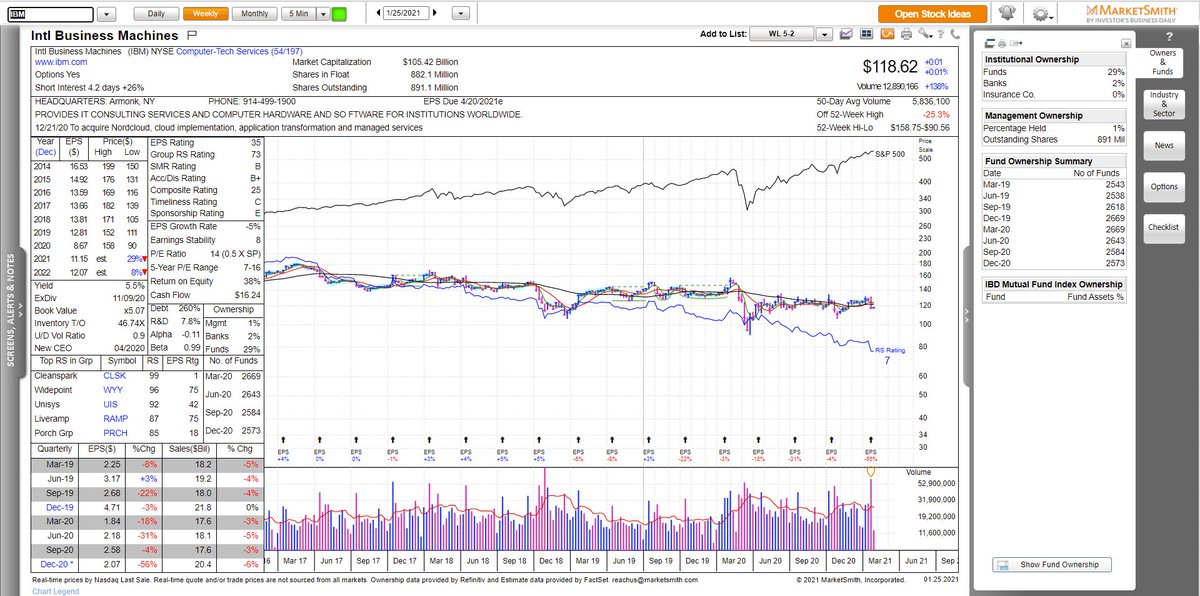
RS Line: The Line plotted by dividing each day’s stock price/ price of the SPX.
-Note RSI (Relative strength index) is something completely unrelated to the concept of this thread.
RS rating: 7, decreasing RS line
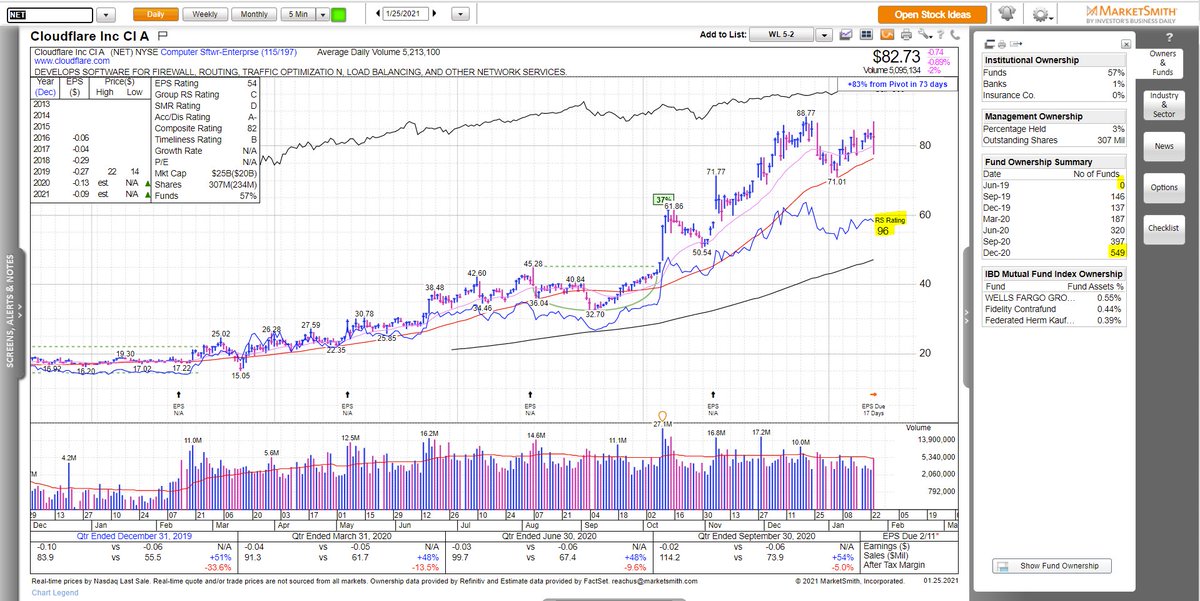
NET is an example
RS rating of 98, ⬆️ RS line and # of funds.
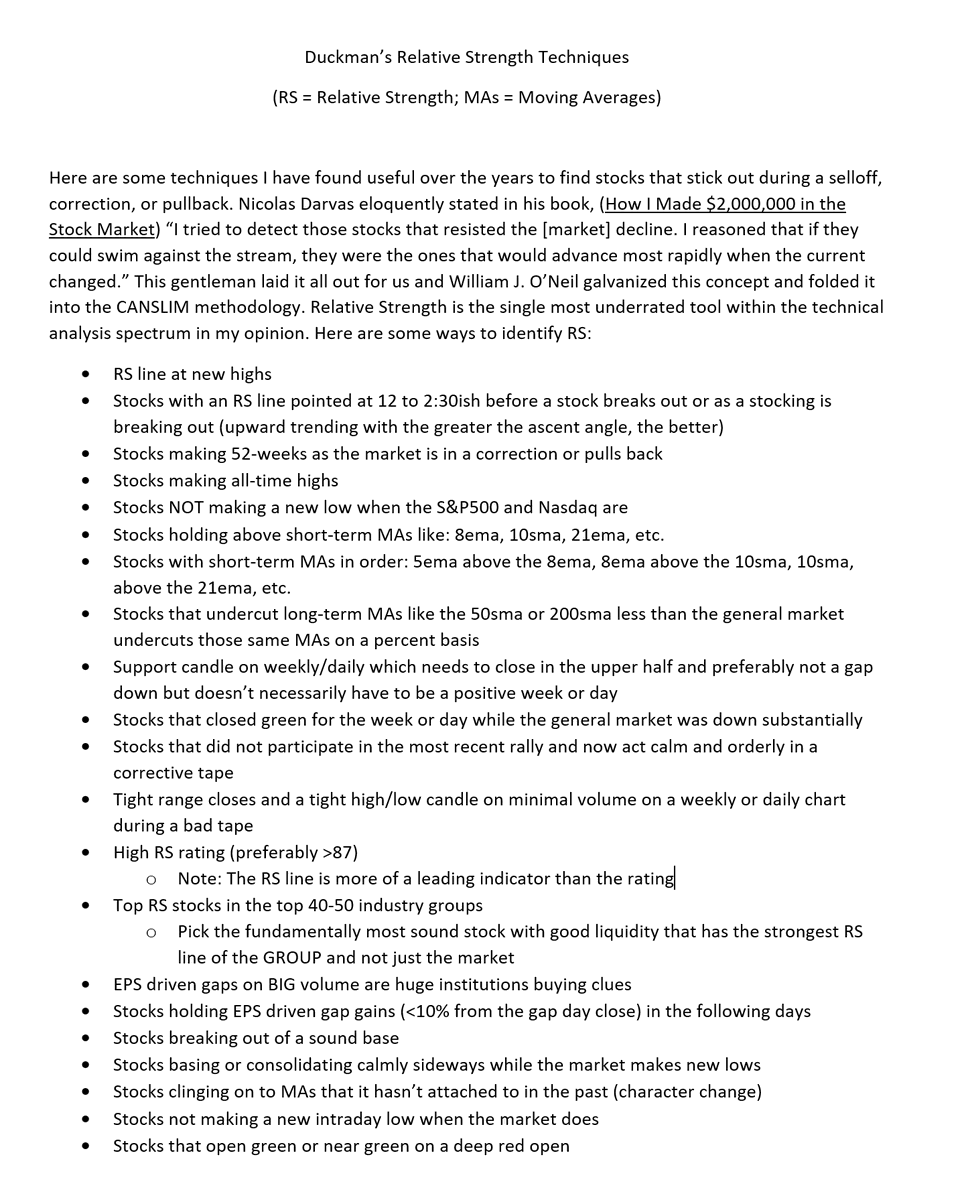
There are many different ways summarized extremely well by @duckman1717 in the document below and I will expand on a couple of these concepts.
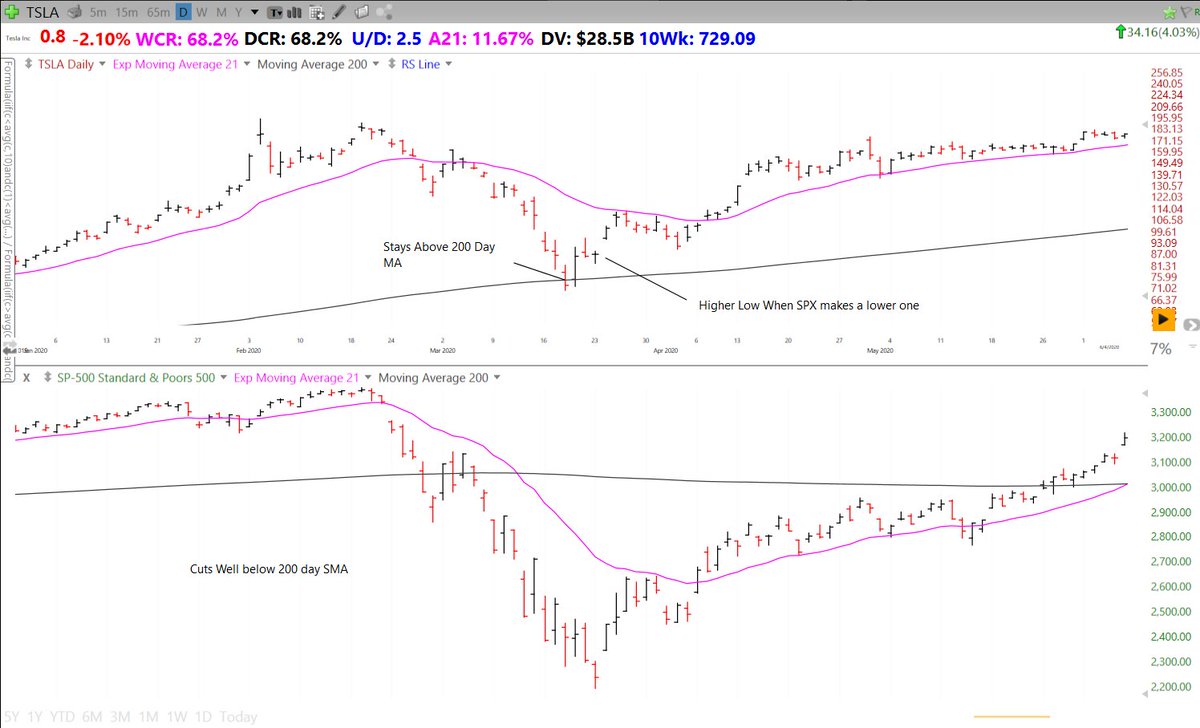
Makes a higher Low when the SPX makes a lower one
Stays above 200day SMA while SPX undercuts by 28%
The Leaders often bottom before the indexes
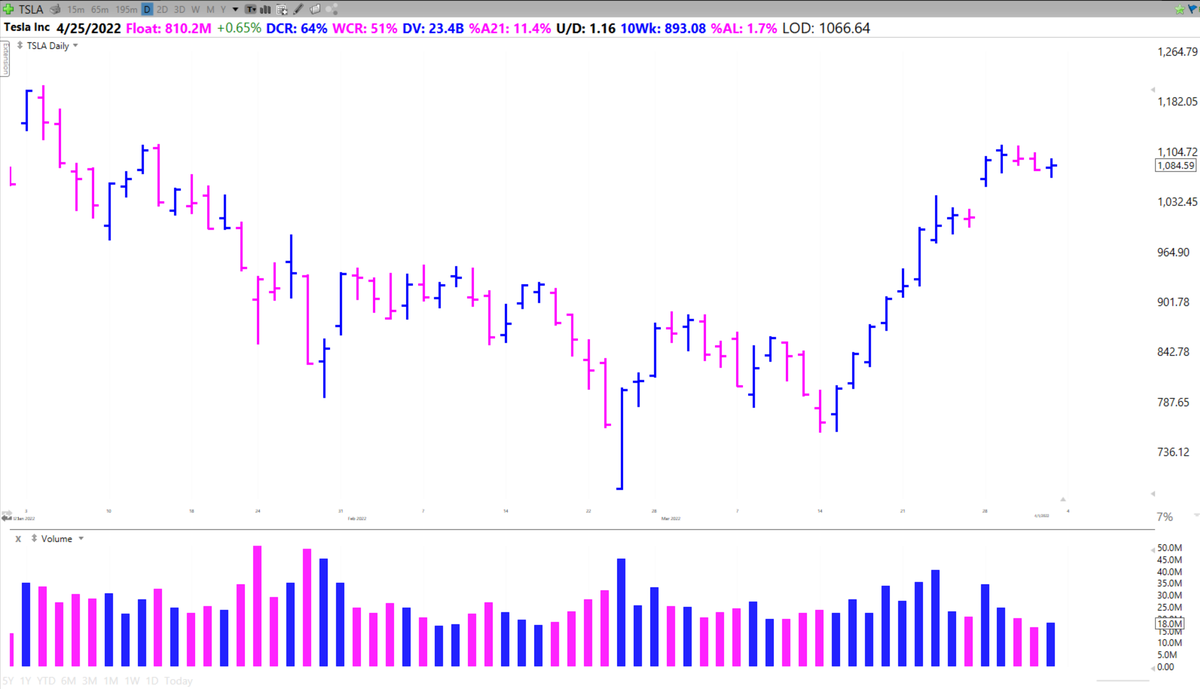
$TSLA increased 800% from this point in 9 months
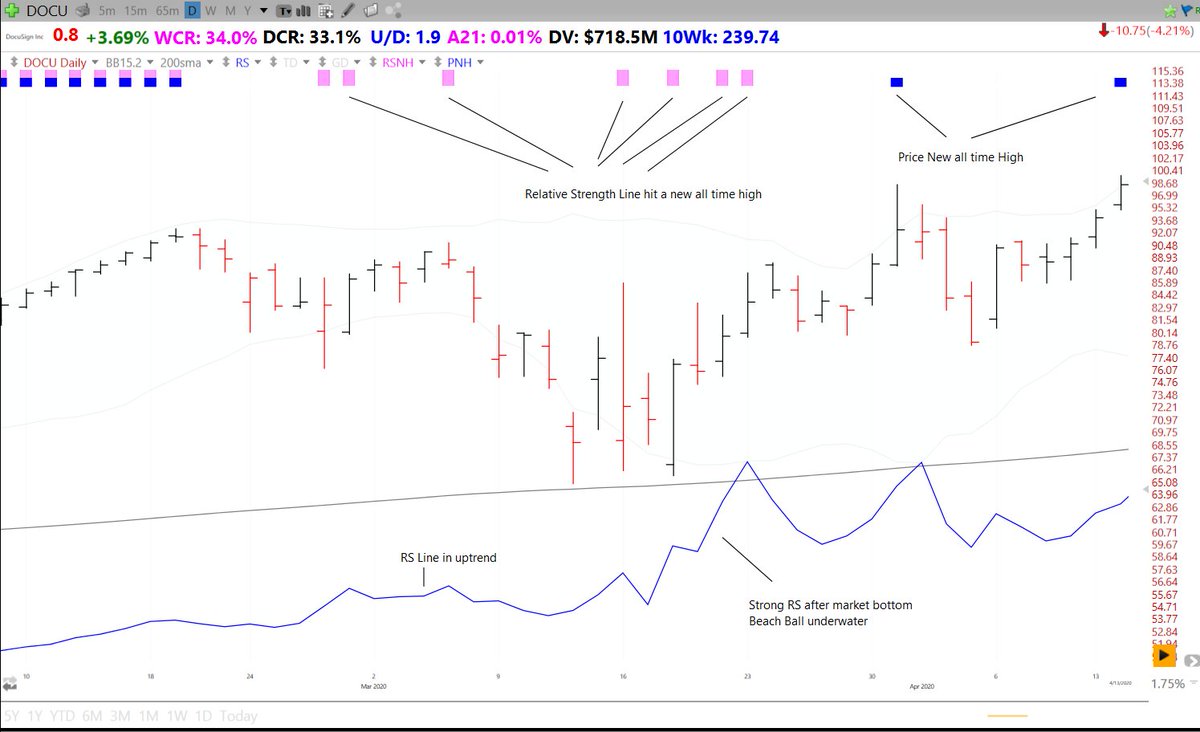
Higher Low again
RS Line hitting new all time highs during correction
Strong bounce once market pressure lifts
Broke out to new all time highs shortly after correction
$DOCU increased 120% in 3 months
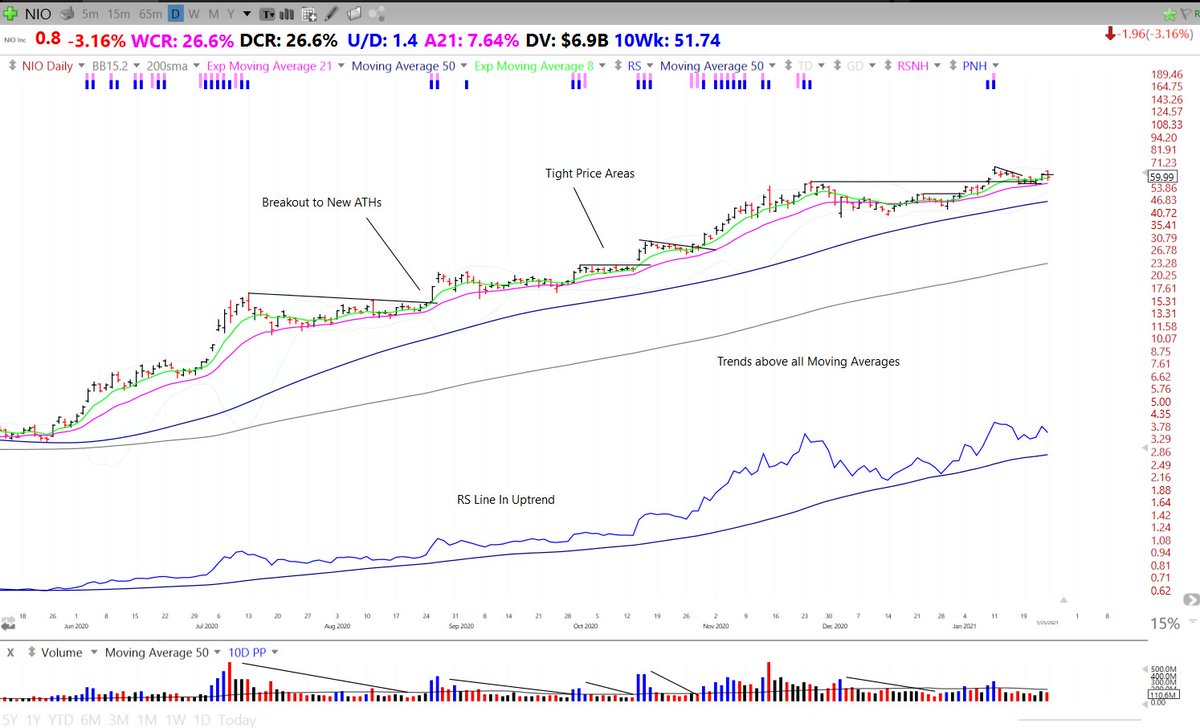
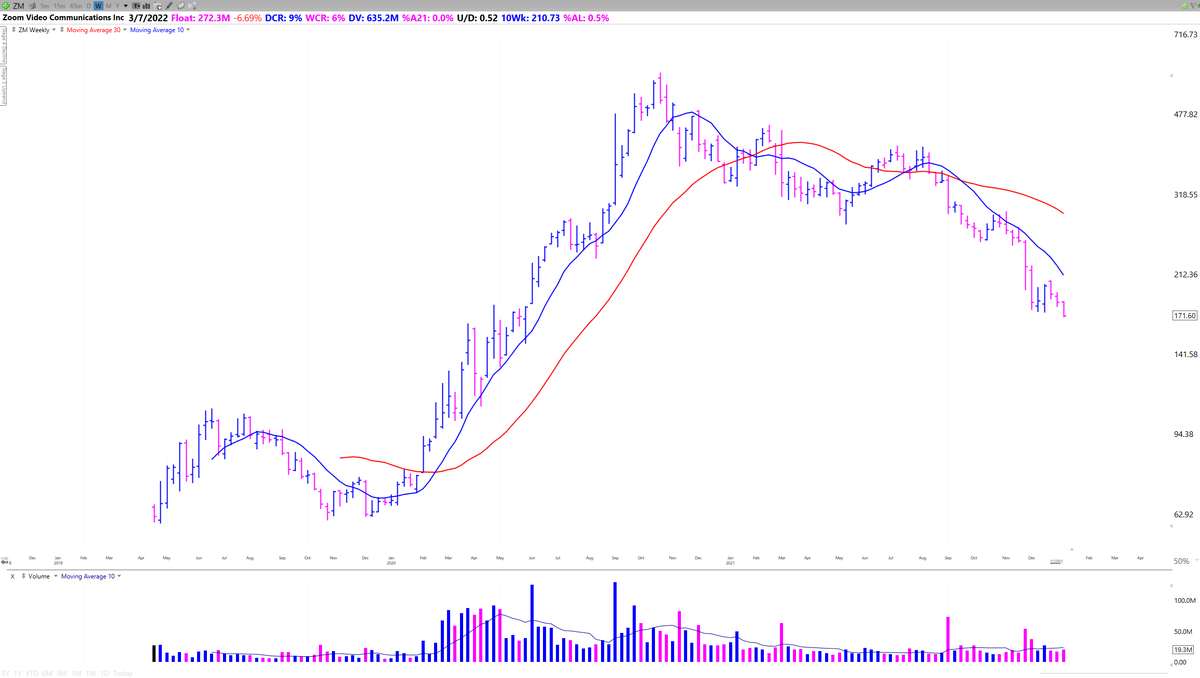
Trends above all Key Moving Averages
RS Line in Uptrend
Forms Tight Price areas then breaks out.
Pullbacks are on lower volume than advances
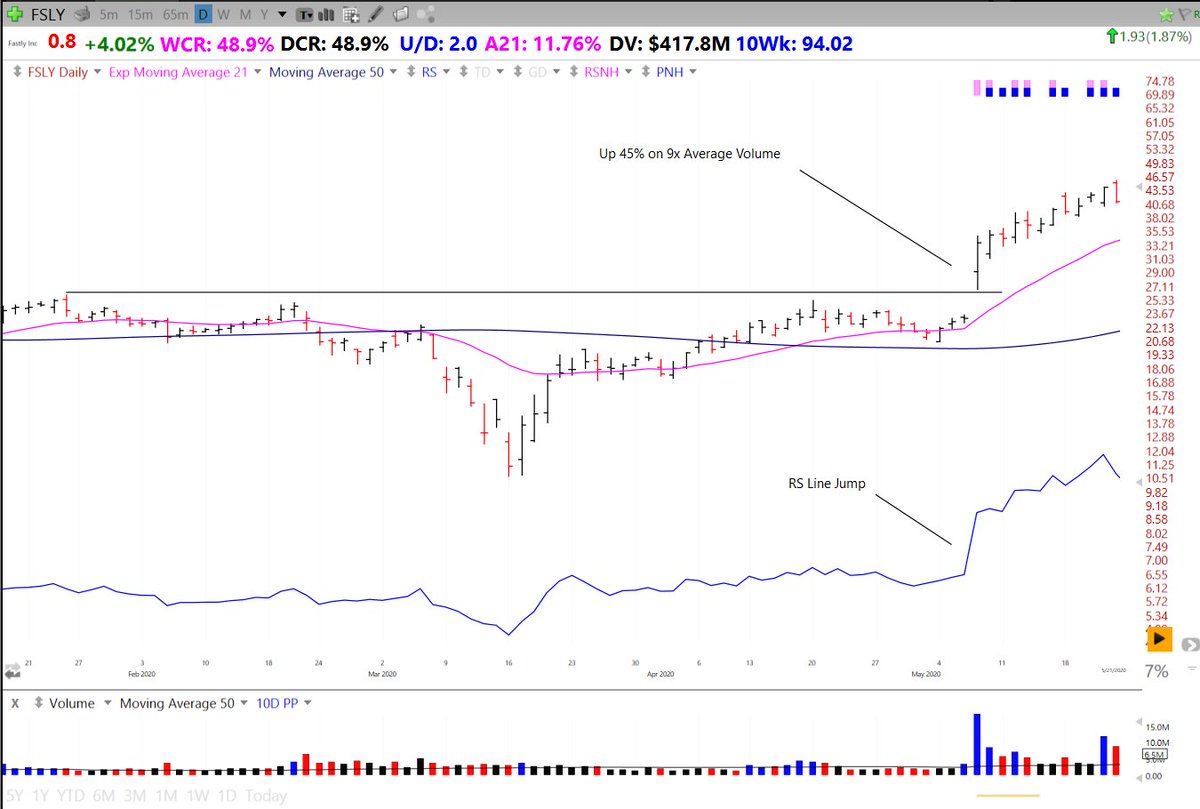
Increased 1000% in 6 months while trending with the 21ema
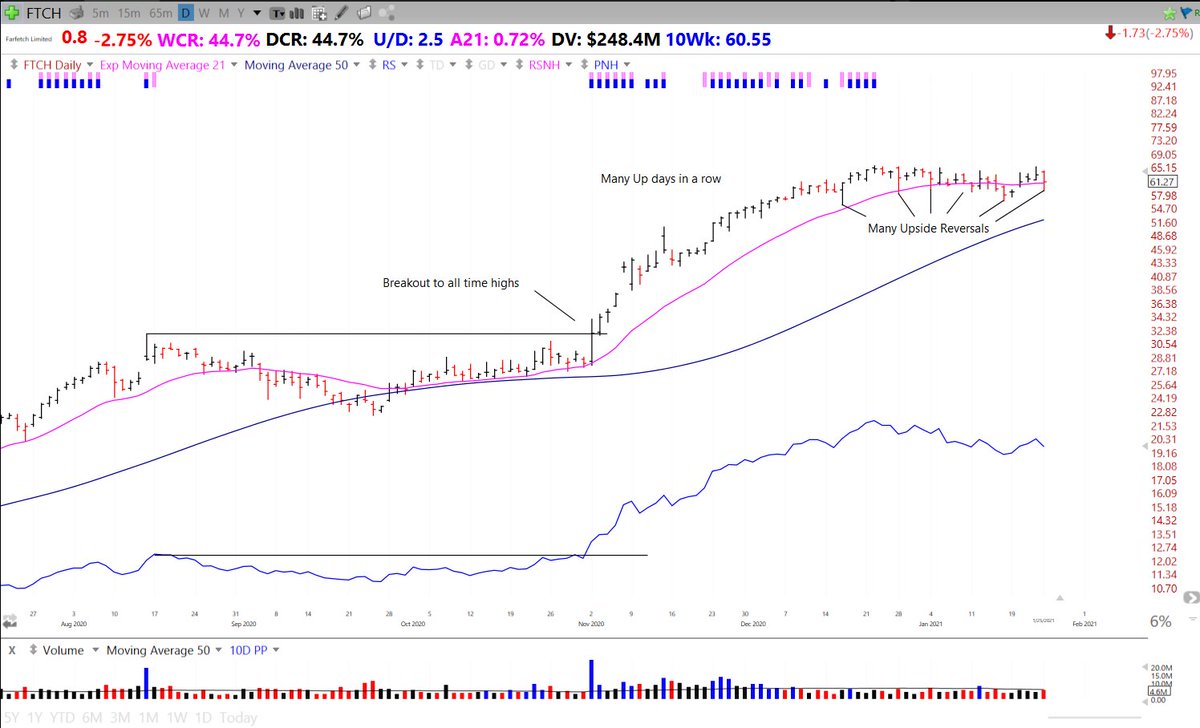
Breakout on large volume to all time highs
Many up days in a row
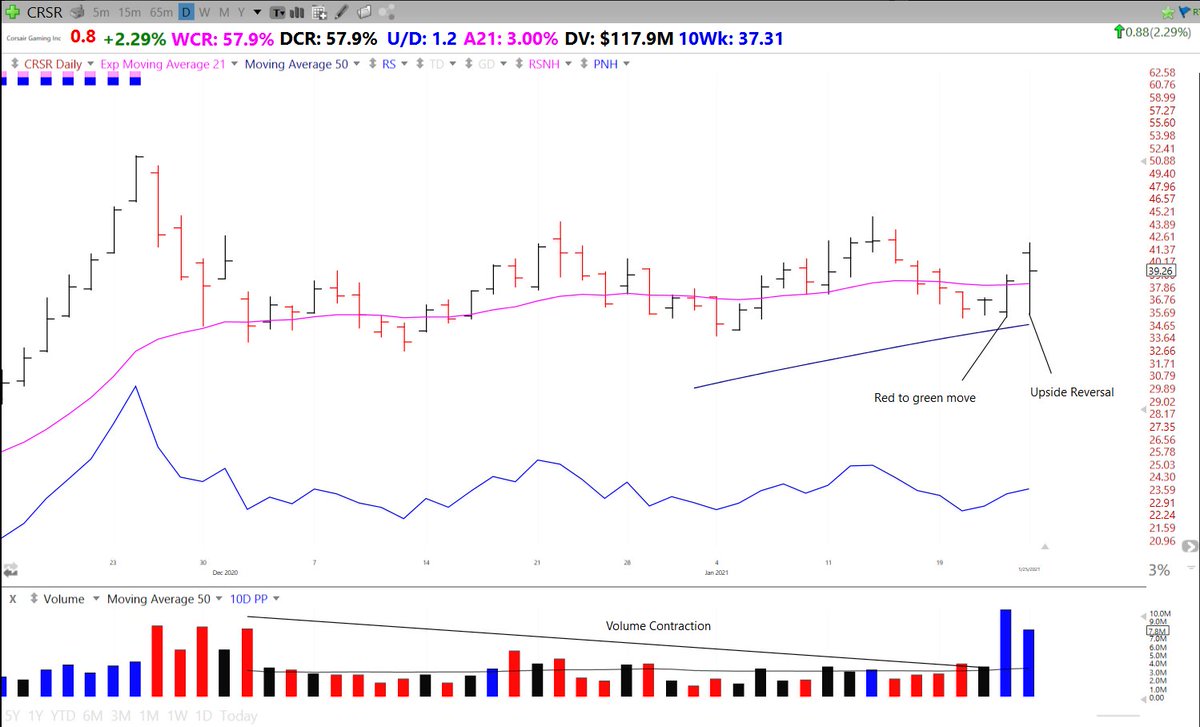
Upside reversals near the bottom of price consolidations
Tight price action during correction and right before BO
Increased 100% in 1.5 months from the breakout
Red to green move on a gap down day
Upside reversal
Prior Uptrend and Volume Contraction within base
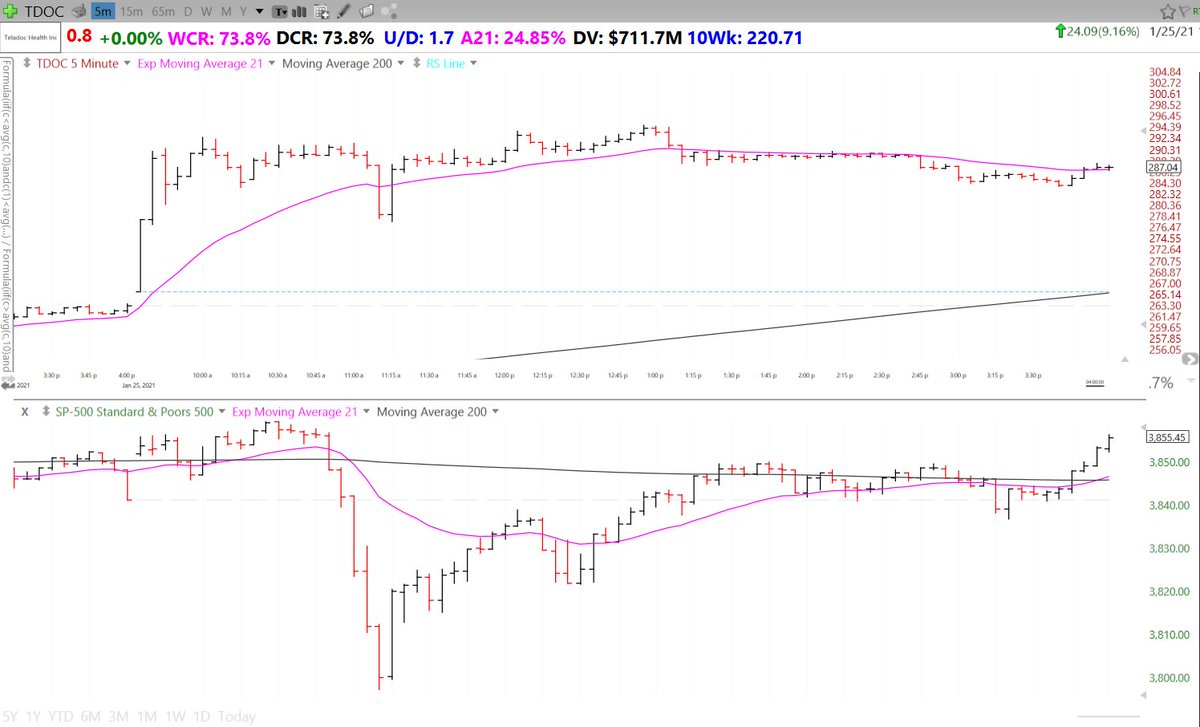
5 minute chart with SPX comparison
For instance:
- Earnings gap ups from Bases on large volume
- Newfound respect for a key moving average
Avoid
- Gap downs on large volume
- Breaking previously respected KMAs
- Red to green moves
- Green on Red days
- High DCR +WCR compared to $SPX
- Closing well off lows
- Tight price action compared to $SPX
- RS line ⬆️
- Pullbacks are on low vol
- Pick stocks with increasing RS Lines + other Signs of RS
- On red days track what is showing RS
- During corrections cut weak stocks first
- During Bear Markets track RS signs- Future Leaders
https://t.co/gCwio1qYWX
What is Relative Strength (RS) and how to identify it (Thread)
— Richard Moglen \U0001f4fd\ufe0f\U0001f981\U0001f6a2 (@RichardMoglen) January 25, 2021
What is an Optimal Buy Point? (thread)
— Richard Moglen \U0001f4fd\ufe0f\U0001f981\U0001f6a2 (@RichardMoglen) August 29, 2020
What is a True Market Leader / TML (Thread)
— Richard Moglen \U0001f4fd\ufe0f\U0001f981\U0001f6a2 (@RichardMoglen) November 6, 2020
(And how to find them)
An Introduction to Price and Volume Action (thread)
— Richard Moglen \U0001f4fd\ufe0f\U0001f981\U0001f6a2 (@RichardMoglen) December 4, 2020
More from Richard Moglen 📽️🦁🚢
How to time the market (thread)
There is the old saying that “Time in the market beats timing the market” The chart below from Dr. Wish’s @WishingWealth presentation at the @TraderLion_ conference shows that to be false.
Full presentation: https://t.co/o2f21GBXci
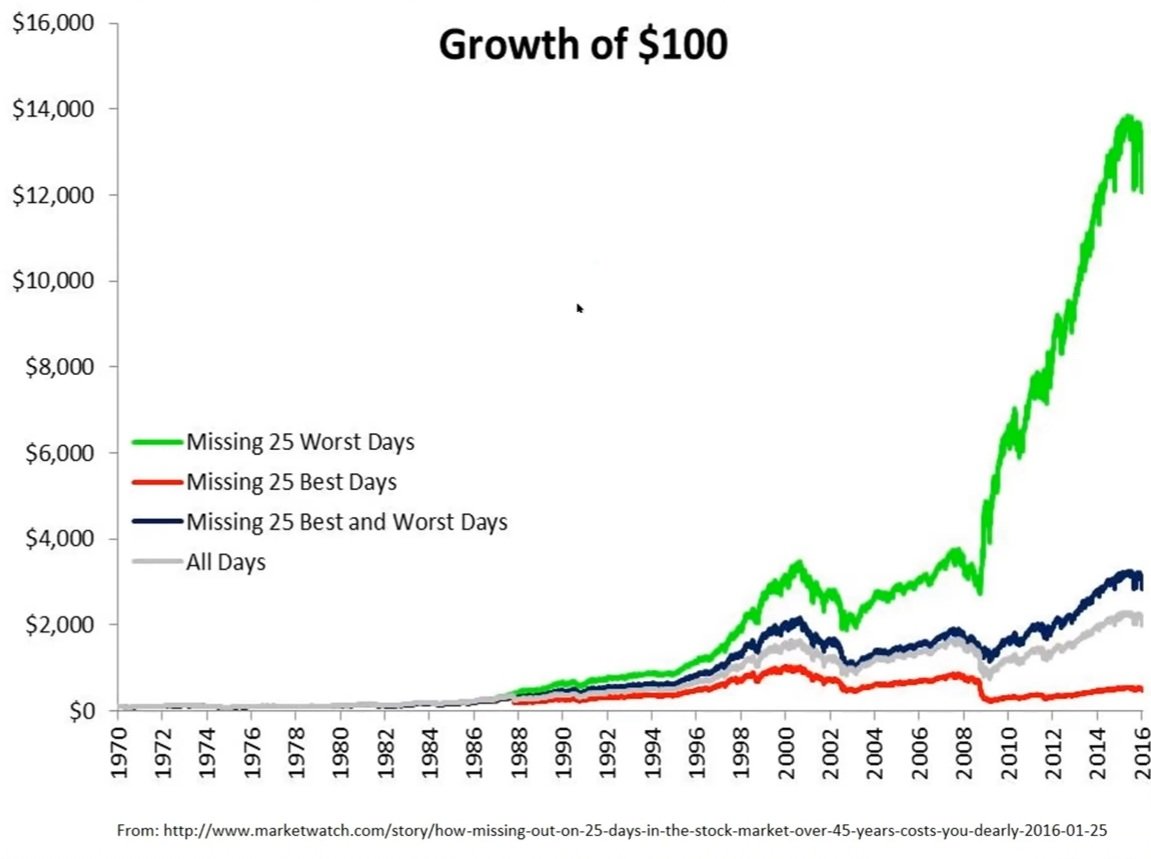
The green line is unattainable realistically, however, missing volatile times during corrections yields better performance than buy and hold and we can aim for the green line.
Investors usually only show the gray and red results.
More
There are many strategies for investing/trading in the stock market operating within different timeframes and with different objectives.
That is of course what creates a market and opportunity. Timing the market may not be what works for you or what fits your goals/lifestyle.
However, everyone involved in the market is here to make money over time and corrections can cause huge drawdowns in the high alpha names negating incredible performance during strong market uptrends.
There is the old saying that “Time in the market beats timing the market” The chart below from Dr. Wish’s @WishingWealth presentation at the @TraderLion_ conference shows that to be false.
Full presentation: https://t.co/o2f21GBXci
The green line is unattainable realistically, however, missing volatile times during corrections yields better performance than buy and hold and we can aim for the green line.
Investors usually only show the gray and red results.
More
There are many strategies for investing/trading in the stock market operating within different timeframes and with different objectives.
That is of course what creates a market and opportunity. Timing the market may not be what works for you or what fits your goals/lifestyle.
However, everyone involved in the market is here to make money over time and corrections can cause huge drawdowns in the high alpha names negating incredible performance during strong market uptrends.


More from Traderlion

The market’s best investors have made millions from the simple saying:
“Buy right, sit tight”
Sounds simple - but what does “buying right” even mean?
Use TraderLion's 10-Step Ultimate Guide to buying right 👇
By the end of this thread, you'll know how to:
1. Build an objective list of buy criteria
2. Have 10+ real world examples to study
3. Increase your win rate.
4. Increase your profitability
Let's dive in!
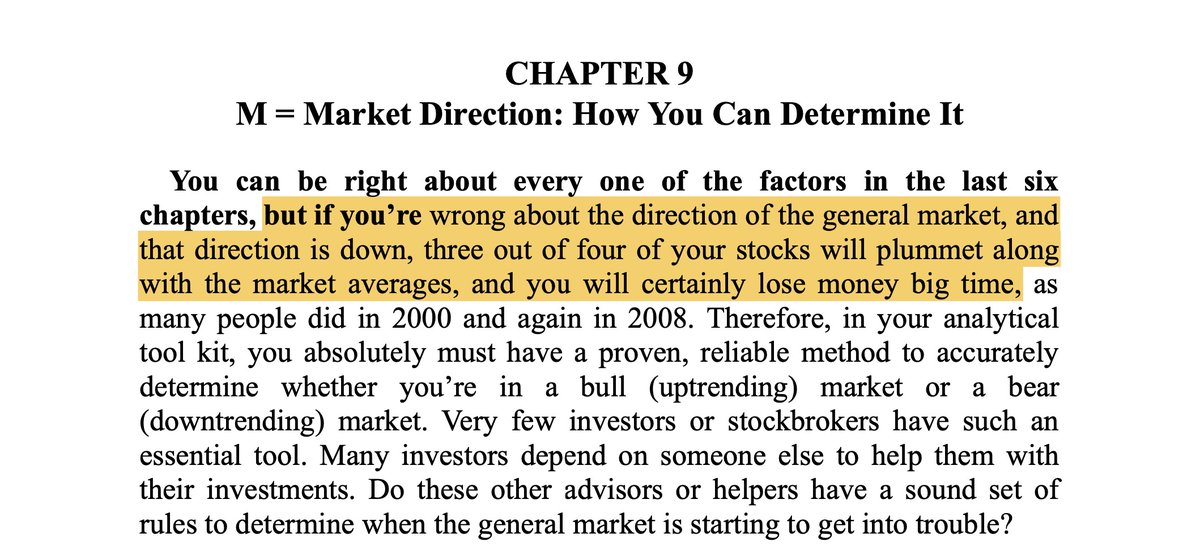
Buy Rule #1: The General market must be in an uptrend.
3 out of every 4 stocks follow the market trend both to the upside and to the downside.
This means that if you are buying a breakout in a downtrend, it already has a 75% chance of failing!
It doesn't matter if the stock is in a leading group with an impressive RS line and strong fundamental story.
At the end of the day, market direction is the MOST important factor!
Here's an excerpt from How To Make Money In Stocks by stock market legend William O'Neil:
Here's another video by @richardmoglen that will help you determine if the stock market is in a downtrend:
https://t.co/shD5OjkP6s
Let's move on to #2.
“Buy right, sit tight”
Sounds simple - but what does “buying right” even mean?
Use TraderLion's 10-Step Ultimate Guide to buying right 👇
By the end of this thread, you'll know how to:
1. Build an objective list of buy criteria
2. Have 10+ real world examples to study
3. Increase your win rate.
4. Increase your profitability
Let's dive in!
Buy Rule #1: The General market must be in an uptrend.
3 out of every 4 stocks follow the market trend both to the upside and to the downside.
This means that if you are buying a breakout in a downtrend, it already has a 75% chance of failing!
It doesn't matter if the stock is in a leading group with an impressive RS line and strong fundamental story.
At the end of the day, market direction is the MOST important factor!
Here's an excerpt from How To Make Money In Stocks by stock market legend William O'Neil:
Here's another video by @richardmoglen that will help you determine if the stock market is in a downtrend:
https://t.co/shD5OjkP6s
Let's move on to #2.


You May Also Like

And here they are...
THE WINNERS OF THE 24 HOUR STARTUP CHALLENGE
Remember, this money is just fun. If you launched a product (or even attempted a launch) - you did something worth MUCH more than $1,000.
#24hrstartup
The winners 👇
#10
Lattes For Change - Skip a latte and save a life.
https://t.co/M75RAirZzs
@frantzfries built a platform where you can see how skipping your morning latte could do for the world.
A great product for a great cause.
Congrats Chris on winning $250!

#9
Instaland - Create amazing landing pages for your followers.
https://t.co/5KkveJTAsy
A team project! @bpmct and @BaileyPumfleet built a tool for social media influencers to create simple "swipe up" landing pages for followers.
Really impressive for 24 hours. Congrats!

#8
SayHenlo - Chat without distractions
https://t.co/og0B7gmkW6
Built by @DaltonEdwards, it's a platform for combatting conversation overload. This product was also coded exclusively from an iPad 😲
Dalton is a beast. I'm so excited he placed in the top 10.
#7
CoderStory - Learn to code from developers across the globe!
https://t.co/86Ay6nF4AY
Built by @jesswallaceuk, the project is focused on highlighting the experience of developers and people learning to code.
I wish this existed when I learned to code! Congrats on $250!!

THE WINNERS OF THE 24 HOUR STARTUP CHALLENGE
Remember, this money is just fun. If you launched a product (or even attempted a launch) - you did something worth MUCH more than $1,000.
#24hrstartup
The winners 👇
#10
Lattes For Change - Skip a latte and save a life.
https://t.co/M75RAirZzs
@frantzfries built a platform where you can see how skipping your morning latte could do for the world.
A great product for a great cause.
Congrats Chris on winning $250!
#9
Instaland - Create amazing landing pages for your followers.
https://t.co/5KkveJTAsy
A team project! @bpmct and @BaileyPumfleet built a tool for social media influencers to create simple "swipe up" landing pages for followers.
Really impressive for 24 hours. Congrats!
#8
SayHenlo - Chat without distractions
https://t.co/og0B7gmkW6
Built by @DaltonEdwards, it's a platform for combatting conversation overload. This product was also coded exclusively from an iPad 😲
Dalton is a beast. I'm so excited he placed in the top 10.
#7
CoderStory - Learn to code from developers across the globe!
https://t.co/86Ay6nF4AY
Built by @jesswallaceuk, the project is focused on highlighting the experience of developers and people learning to code.
I wish this existed when I learned to code! Congrats on $250!!