Some people really benefit from hearing advice that everyone knows, for the same reason we keep schools open despite every subject in them having been taught before.
In that spirit, here's some quick Things Many People Find Too Obvious To Have Told You Already.
Charge more. Charge more still. Go on.
We don't see most of it every day for the same reason abstractions protect us from having to care about metallurgy while programming.
Serious people in positions of power eat Thanksgiving dinners, too. Guess what they ask at them.
More from Patrick McKenzie
I like this heuristic, and have a few which are similar in intent to it:
Hiring efficiency:
How long does it take, measured from initial expression of interest through offer of employment signed, for a typical candidate cold inbounding to the company?
What is the *theoretical minimum* for *any* candidate?
How long does it take, as a developer newly hired at the company:
* To get a fully credentialed machine issued to you
* To get a fully functional development environment on that machine which could push code to production immediately
* To solo ship one material quanta of work
How long does it take, from first idea floated to "It's on the Internet", to create a piece of marketing collateral.
(For bonus points: break down by ambitiousness / form factor.)
How many people have to say yes to do something which is clearly worth doing which costs $5,000 / $15,000 / $250,000 and has never been done before.
Here's how I'd measure the health of any tech company:
— Jeff Atwood (@codinghorror) October 25, 2018
How long, as measured from the inception of idea to the modified software arriving in the user's hands, does it take to roll out a *1 word copy change* in your primary product?
Hiring efficiency:
How long does it take, measured from initial expression of interest through offer of employment signed, for a typical candidate cold inbounding to the company?
What is the *theoretical minimum* for *any* candidate?
How long does it take, as a developer newly hired at the company:
* To get a fully credentialed machine issued to you
* To get a fully functional development environment on that machine which could push code to production immediately
* To solo ship one material quanta of work
How long does it take, from first idea floated to "It's on the Internet", to create a piece of marketing collateral.
(For bonus points: break down by ambitiousness / form factor.)
How many people have to say yes to do something which is clearly worth doing which costs $5,000 / $15,000 / $250,000 and has never been done before.
More from Tech
What an amazing presentation! Loved how @ravidharamshi77 brilliantly started off with global macros & capital markets, and then gradually migrated to Indian equities, summing up his thesis for a bull market case!
@MadhusudanKela @VQIndia @sameervq
My key learnings: ⬇️⬇️⬇️
First, the BEAR case:
1. Bitcoin has surpassed all the bubbles of the last 45 years in extent that includes Gold, Nikkei, dotcom bubble.
2. Cyclically adjusted PE ratio for S&P 500 almost at 1929 (The Great Depression) peaks, at highest levels except the dotcom crisis in 2000.
3. World market cap to GDP ratio presently at 124% vs last 5 years average of 92% & last 10 years average of 85%.
US market cap to GDP nearing 200%.
4. Bitcoin (as an asset class) has moved to the 3rd place in terms of price gains in preceding 3 years before peak (900%); 1st was Tulip bubble in 17th century (rising 2200%).
@MadhusudanKela @VQIndia @sameervq
My key learnings: ⬇️⬇️⬇️
Bubble or Bull Market? Join us for a short presentation and candid one on one on 27th Jan, 4pm with Shri \u2066@MadhusudanKela\u2069. \u2066@VQIndia\u2069 \u2066@sameervq\u2069 #bubbleorbullmarket pic.twitter.com/LBvlBrz6mS
— Ravi Dharamshi (@ravidharamshi77) January 24, 2021
First, the BEAR case:
1. Bitcoin has surpassed all the bubbles of the last 45 years in extent that includes Gold, Nikkei, dotcom bubble.
2. Cyclically adjusted PE ratio for S&P 500 almost at 1929 (The Great Depression) peaks, at highest levels except the dotcom crisis in 2000.
3. World market cap to GDP ratio presently at 124% vs last 5 years average of 92% & last 10 years average of 85%.
US market cap to GDP nearing 200%.
4. Bitcoin (as an asset class) has moved to the 3rd place in terms of price gains in preceding 3 years before peak (900%); 1st was Tulip bubble in 17th century (rising 2200%).
You May Also Like
1/OK, data mystery time.
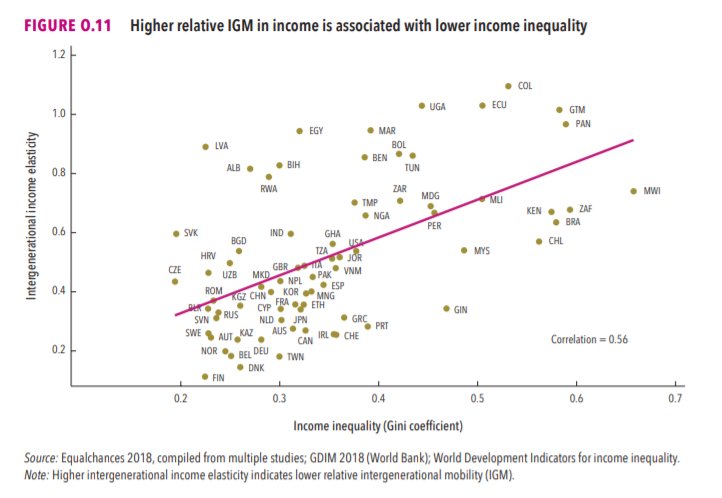
This New York Times feature shows China with a Gini Index of less than 30, which would make it more equal than Canada, France, or the Netherlands. https://t.co/g3Sv6DZTDE
That's weird. Income inequality in China is legendary.
Let's check this number.
2/The New York Times cites the World Bank's recent report, "Fair Progress? Economic Mobility across Generations Around the World".
The report is available here:
3/The World Bank report has a graph in which it appears to show the same value for China's Gini - under 0.3.
The graph cites the World Development Indicators as its source for the income inequality data.

4/The World Development Indicators are available at the World Bank's website.
Here's the Gini index: https://t.co/MvylQzpX6A
It looks as if the latest estimate for China's Gini is 42.2.
That estimate is from 2012.
5/A Gini of 42.2 would put China in the same neighborhood as the U.S., whose Gini was estimated at 41 in 2013.
I can't find the <30 number anywhere. The only other estimate in the tables for China is from 2008, when it was estimated at 42.8.
This New York Times feature shows China with a Gini Index of less than 30, which would make it more equal than Canada, France, or the Netherlands. https://t.co/g3Sv6DZTDE
That's weird. Income inequality in China is legendary.
Let's check this number.
2/The New York Times cites the World Bank's recent report, "Fair Progress? Economic Mobility across Generations Around the World".
The report is available here:
3/The World Bank report has a graph in which it appears to show the same value for China's Gini - under 0.3.
The graph cites the World Development Indicators as its source for the income inequality data.

4/The World Development Indicators are available at the World Bank's website.
Here's the Gini index: https://t.co/MvylQzpX6A
It looks as if the latest estimate for China's Gini is 42.2.
That estimate is from 2012.
5/A Gini of 42.2 would put China in the same neighborhood as the U.S., whose Gini was estimated at 41 in 2013.
I can't find the <30 number anywhere. The only other estimate in the tables for China is from 2008, when it was estimated at 42.8.


