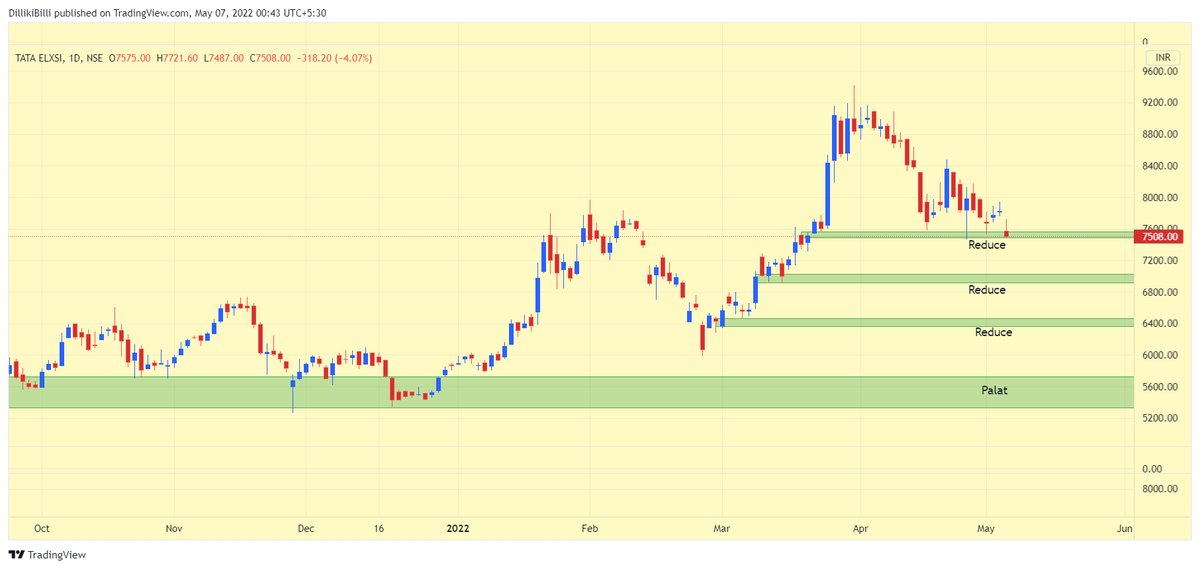
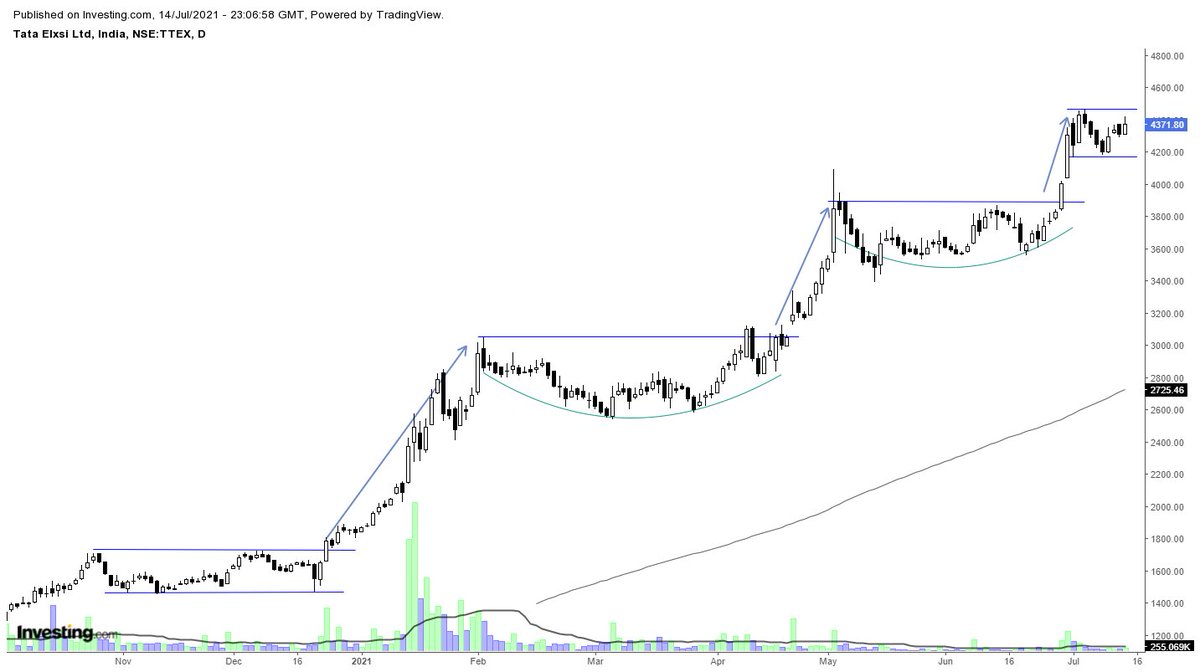
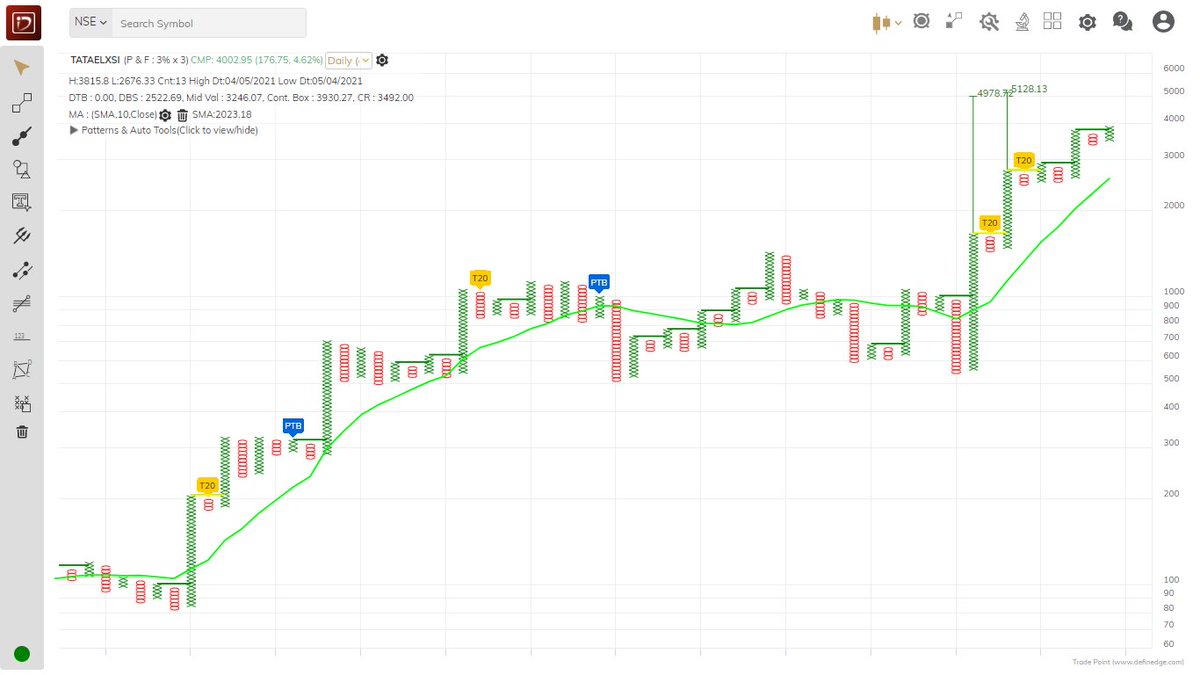
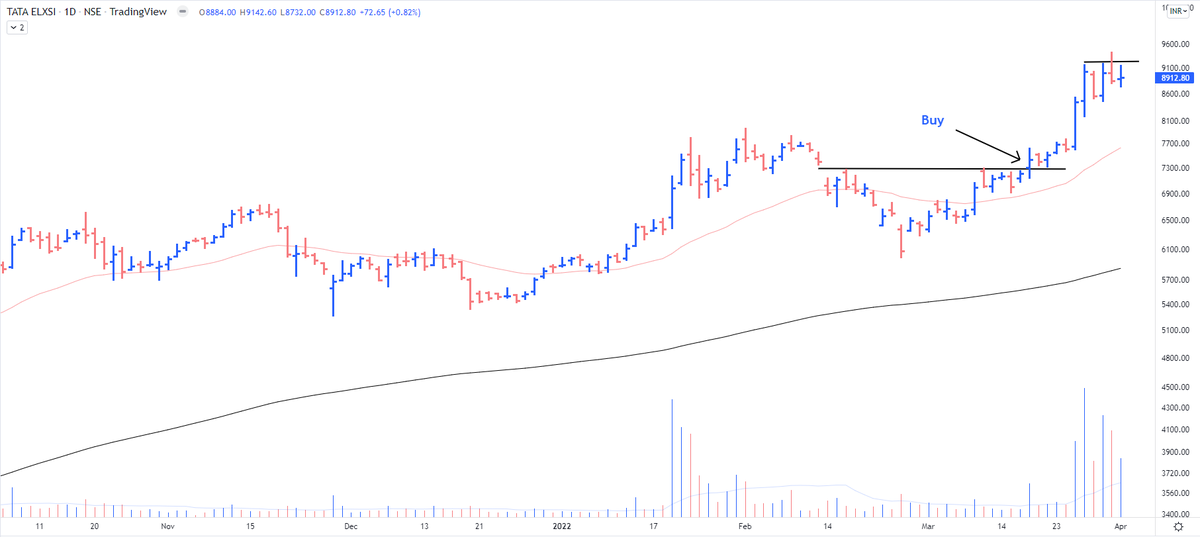
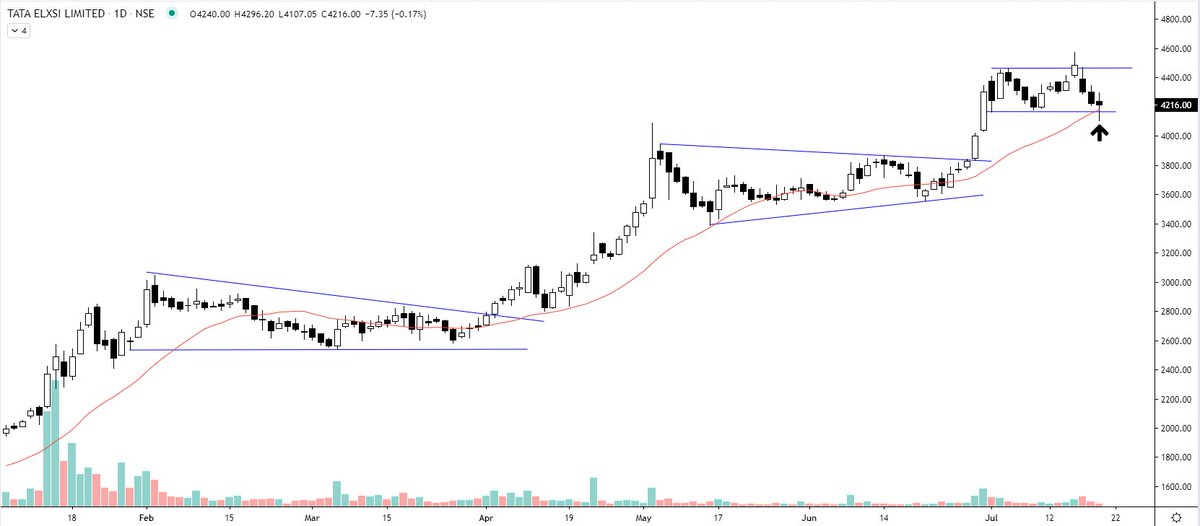
Tata Elxsi levels !
I like this company/Stock immensely.
KPIT chart is already on timeline. https://t.co/Ek9nKOk10D
Tata Elxsi, Kpittech bada dijiye Guruvar
— Ripu Daman Singh (@agraiite) May 6, 2022
More from Professor
Starting the Beginner’s Pathway thread for Fundamental Investing.
One Chadarmod on timeline posted that I’m giving gyan without having experience or expertise.
So I’ll begin with paying my portfolio performance tribute to these charlies.
https://t.co/GNM5SsNFNo
Fundamentals based investing can generate serious wealth as the most famous (rather infamous) Warren Buffett has shown.
In India also we have many success stories like @VijayKedia1 @Raamdeo R K Damani Rakesh Jhunjhunwala Late Chandrakant Sampat and many many more....
Though I can't stop mentioning that both Rakesh Jhunjhunwala and R K Damani were traders in their initial days.
Rakesh Jhunjhunwala still trades, he once said Traing is fun, its le fatafat, de fatafat
A lot of people (specially the beginners) buy stocks based on some friend's recommendation : XYZ le le, pukka chalega, maine bhi le rakha hai.
Few might have made money this way, but most do not. Why ?
There has to be a process.
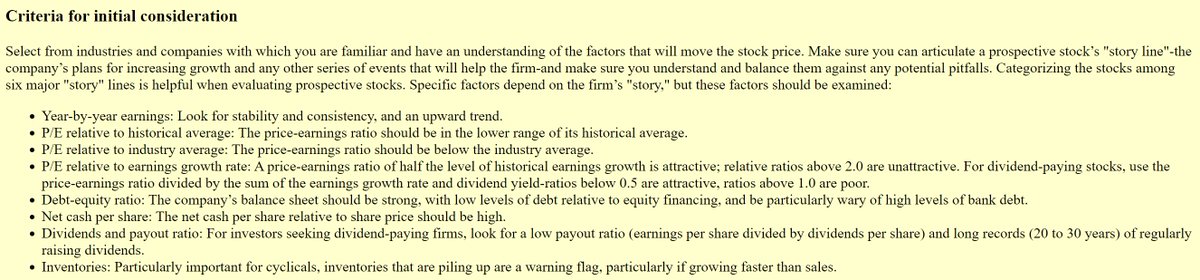
Fundamentals based investing need thorough analysis of the Business & Company.
Here is a preliminary checklist by the legendary investor Peter lynch
One Chadarmod on timeline posted that I’m giving gyan without having experience or expertise.
So I’ll begin with paying my portfolio performance tribute to these charlies.
https://t.co/GNM5SsNFNo
Sadda Haqq ! Aithe Rakhh......... pic.twitter.com/IH5q3v2gw9
— Professor (@DillikiBiili) October 5, 2021
Fundamentals based investing can generate serious wealth as the most famous (rather infamous) Warren Buffett has shown.
In India also we have many success stories like @VijayKedia1 @Raamdeo R K Damani Rakesh Jhunjhunwala Late Chandrakant Sampat and many many more....
Though I can't stop mentioning that both Rakesh Jhunjhunwala and R K Damani were traders in their initial days.
Rakesh Jhunjhunwala still trades, he once said Traing is fun, its le fatafat, de fatafat
A lot of people (specially the beginners) buy stocks based on some friend's recommendation : XYZ le le, pukka chalega, maine bhi le rakha hai.
Few might have made money this way, but most do not. Why ?
There has to be a process.
Fundamentals based investing need thorough analysis of the Business & Company.
Here is a preliminary checklist by the legendary investor Peter lynch
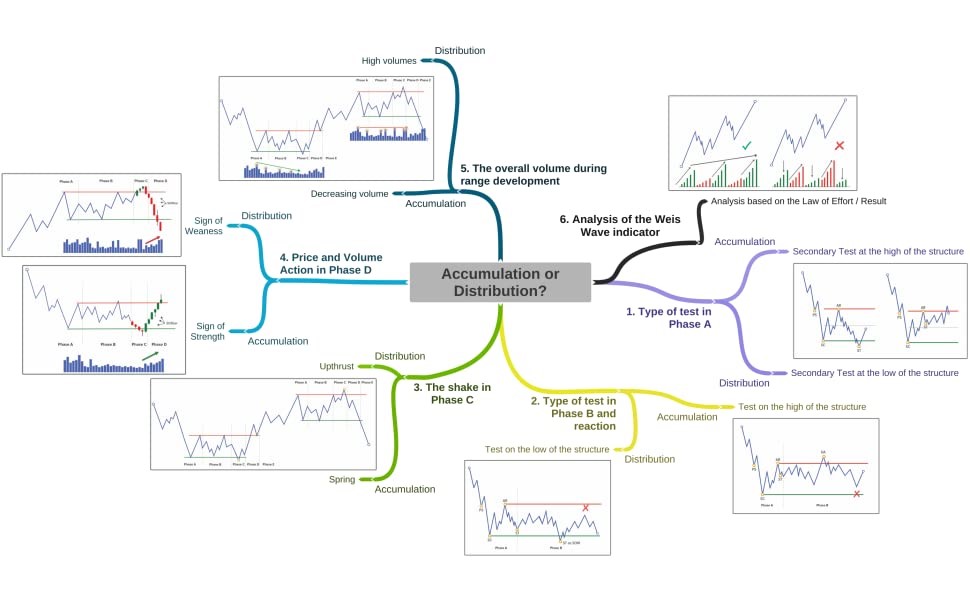
More pointers to help in identifying whether its accumulation or Distribution.
Lest some charlie jumps to point out, let me make it clear that I haven't invented anything in stock market, all my knowledge of stock market comes from old farts. Just my observation is my own. https://t.co/uHNw8tV4AO
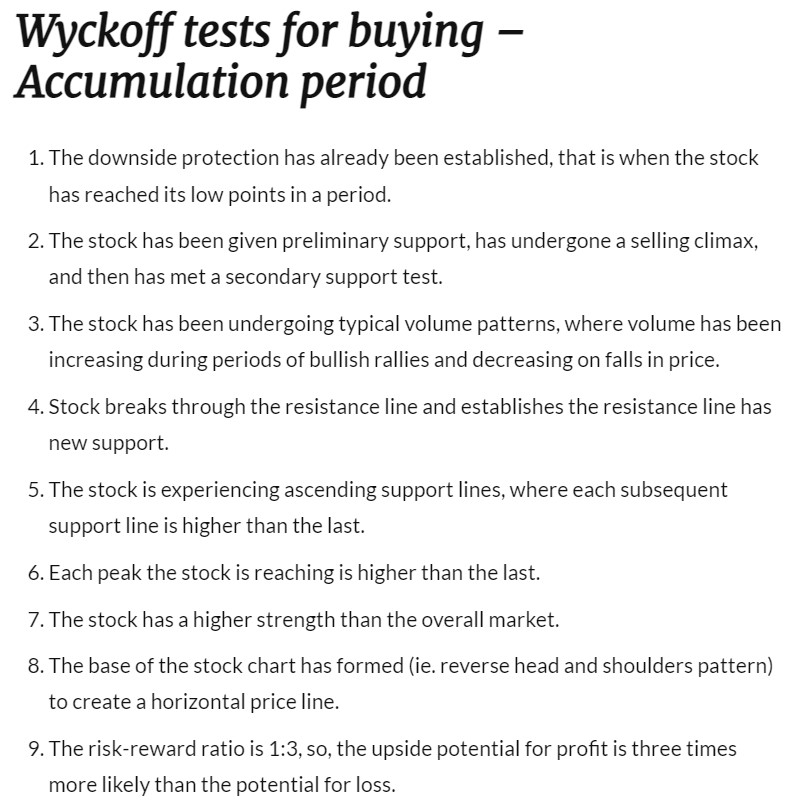
Lest some charlie jumps to point out, let me make it clear that I haven't invented anything in stock market, all my knowledge of stock market comes from old farts. Just my observation is my own. https://t.co/uHNw8tV4AO
Plz advice how to identify accumulation and distribution phase...... to me Both looks same
— VIVEK VAID (@bobvaid) February 12, 2022
More from Tataelxsi

Tata Elxsi - all-time high again. A lot to learn from this chart. ✅ https://t.co/IooKK2EYpy
Tata Elxsi (W) - near to the resistance zone again 5th time. @nishkumar1977 @suru27 @rohanshah619 @indian_stockss @sanstocktrader @BissaGauravB @RajarshitaS @PAVLeader @Rishikesh_ADX @VijayThk @Investor_Mohit @TrendTrader85 @jitendra_stock pic.twitter.com/aIC5kO8XqA
— Steve Nison (@nison_steve) December 18, 2020


You May Also Like

Krugman is, of course, right about this. BUT, note that universities can do a lot to revitalize declining and rural regions.
See this thing that @lymanstoneky wrote:
And see this thing that I wrote:
And see this book that @JamesFallows wrote:
And see this other thing that I wrote:
One thing I've been noticing about responses to today's column is that many people still don't get how strong the forces behind regional divergence are, and how hard to reverse 1/ https://t.co/Ft2aH1NcQt
— Paul Krugman (@paulkrugman) November 20, 2018
See this thing that @lymanstoneky wrote:
And see this thing that I wrote:
And see this book that @JamesFallows wrote:
And see this other thing that I wrote: