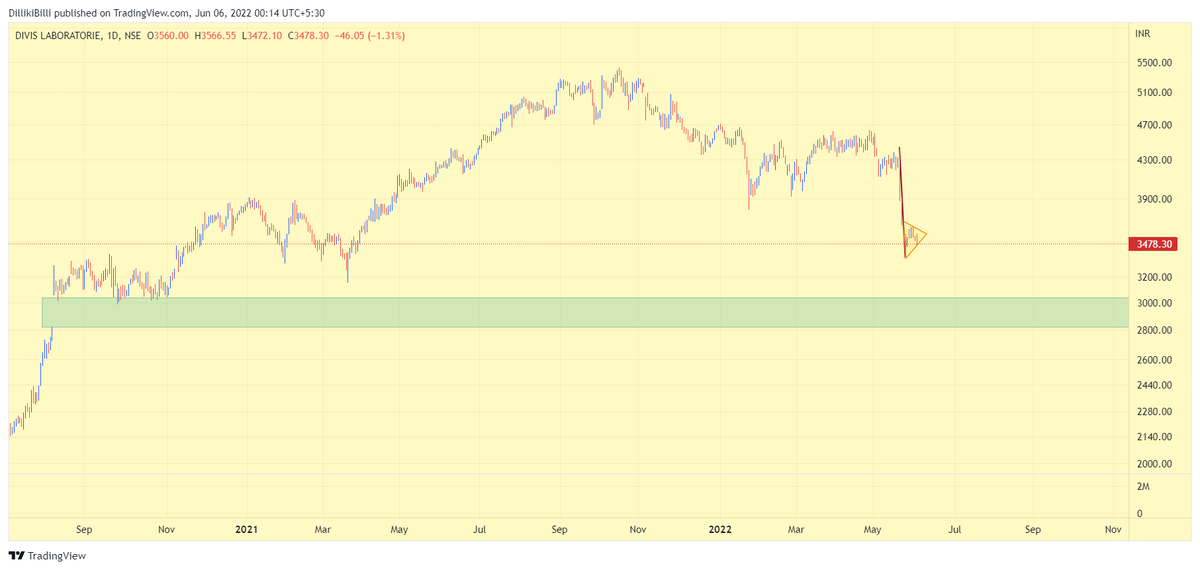
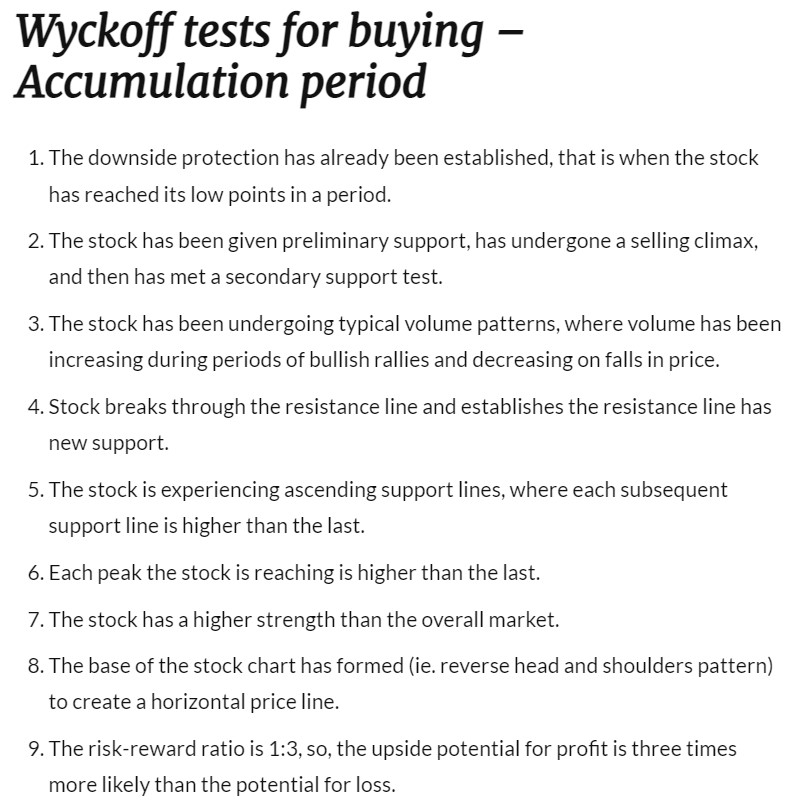
How to judge whether its Accumulation or Distribution, some pointers:
#ProfGyan #StockMarket #StockMarketindia https://t.co/BlJQFriOVa
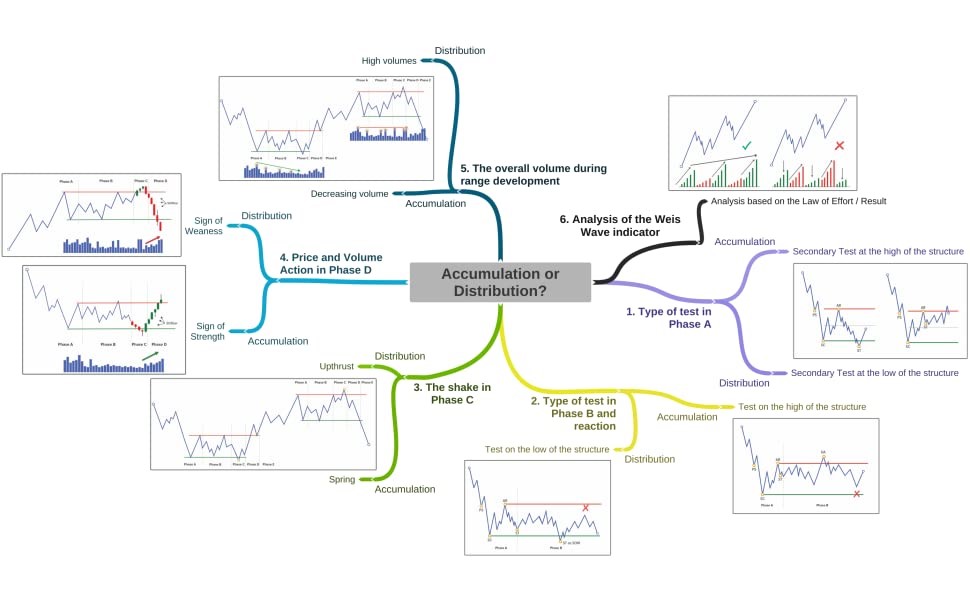
Sir how did you analyse that this is accumulation and not distribution when you posted the entry points earlier.
— Deevaang Daaya (@DayaDevang) March 12, 2022
More from Professor
Have no intention to enjoy the misery of fellow market participants but 'Maine Bola Tha' !
#ProfGyan - If a freak low gets made some day, Stocks/Indices always try to visit it at least once (seekh lo, mere mentorship course ka launch kuch pukka nahi hai) https://t.co/3B6e2nMx0y
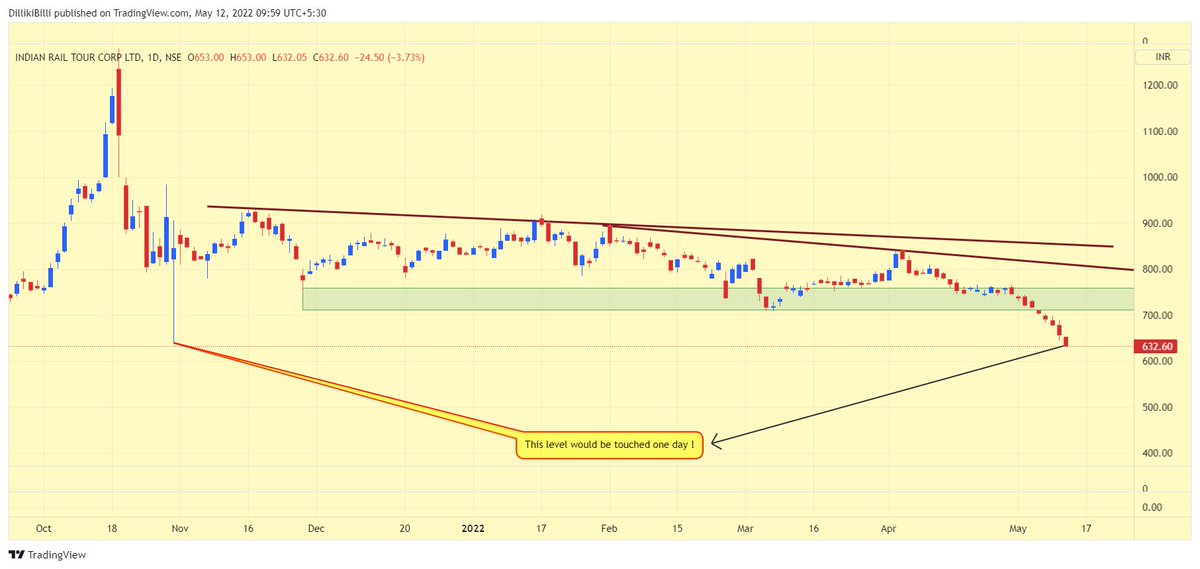
Two prophecies about IRCTC:
— Professor (@DillikiBiili) May 1, 2022
1. It would touch 640 someday
2. It would get expelled from F&O https://t.co/qJ04hG0qFH pic.twitter.com/TPUBSQFW1y
One of the best way that I know is ATR based trailing.
Here is an example https://t.co/BTATx5fyW6
An example of ATR based TSL.
— Professor (@DillikiBiili) April 9, 2021
SL for coming candle is Low of the just completed candle - ATR of previous candle. Chart is self explanatory. https://t.co/D95iv4t5j6 pic.twitter.com/e8BkO2j5rn
Lest some charlie jumps to point out, let me make it clear that I haven't invented anything in stock market, all my knowledge of stock market comes from old farts. Just my observation is my own. https://t.co/uHNw8tV4AO
Plz advice how to identify accumulation and distribution phase...... to me Both looks same
— VIVEK VAID (@bobvaid) February 12, 2022
More from Screeners


Positive signs on inflation include fertilizer prices peaking and trending downward. Used Car prices are also down (which led inflation). The recent price break on the $XLE - which emerged almost to the day the market topped, could be an indication that we are close to a low. pic.twitter.com/2MtcKjjmAz
— Mark Minervini (@markminervini) June 23, 2022
You May Also Like


Like company moats, your personal moat should be a competitive advantage that is not only durable—it should also compound over time.
Characteristics of a personal moat below:
I'm increasingly interested in the idea of "personal moats" in the context of careers.
— Erik Torenberg (@eriktorenberg) November 22, 2018
Moats should be:
- Hard to learn and hard to do (but perhaps easier for you)
- Skills that are rare and valuable
- Legible
- Compounding over time
- Unique to your own talents & interests https://t.co/bB3k1YcH5b
2/ Like a company moat, you want to build career capital while you sleep.
As Andrew Chen noted:
People talk about \u201cpassive income\u201d a lot but not about \u201cpassive social capital\u201d or \u201cpassive networking\u201d or \u201cpassive knowledge gaining\u201d but that\u2019s what you can architect if you have a thing and it grows over time without intensive constant effort to sustain it
— Andrew Chen (@andrewchen) November 22, 2018
3/ You don’t want to build a competitive advantage that is fleeting or that will get commoditized
Things that might get commoditized over time (some longer than
Things that look like moats but likely aren\u2019t or may fade:
— Erik Torenberg (@eriktorenberg) November 22, 2018
- Proprietary networks
- Being something other than one of the best at any tournament style-game
- Many "awards"
- Twitter followers or general reach without "respect"
- Anything that depends on information asymmetry https://t.co/abjxesVIh9
4/ Before the arrival of recorded music, what used to be scarce was the actual music itself — required an in-person artist.
After recorded music, the music itself became abundant and what became scarce was curation, distribution, and self space.
5/ Similarly, in careers, what used to be (more) scarce were things like ideas, money, and exclusive relationships.
In the internet economy, what has become scarce are things like specific knowledge, rare & valuable skills, and great reputations.