TATAELXSI
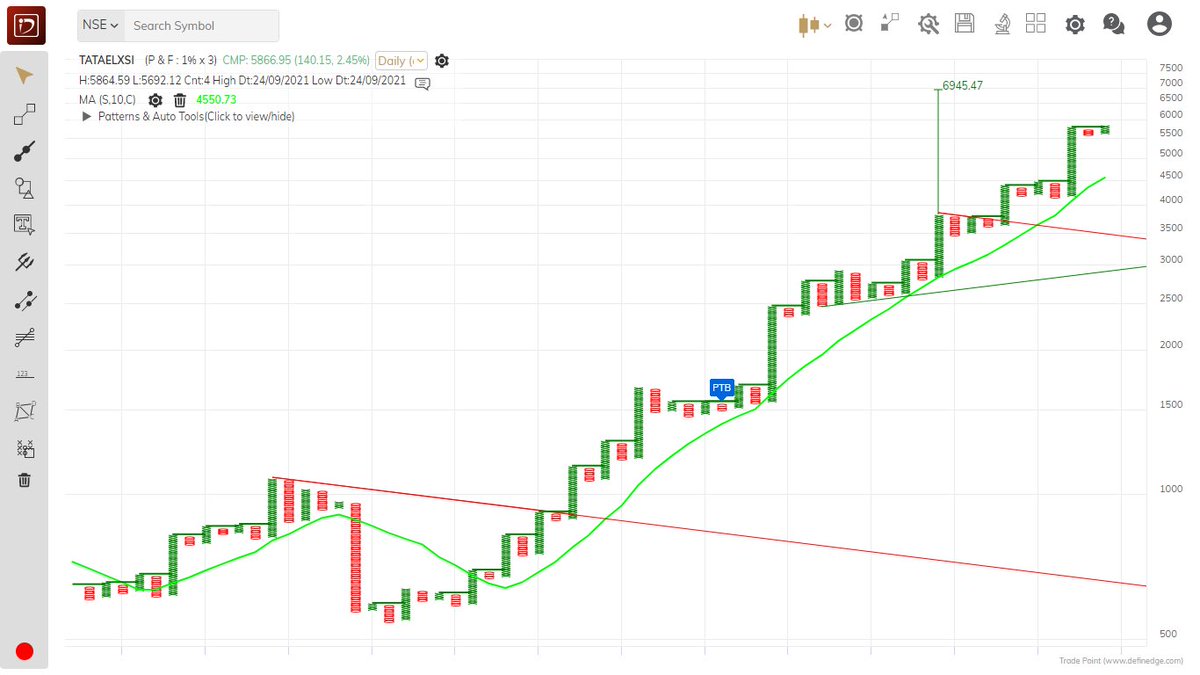
Double Top Buy above 5864.6 daily close on 1% Box Size chart. https://t.co/Zf96t8sfNO
TATAELXSI
— Saket Reddy (@saketreddy) July 15, 2021
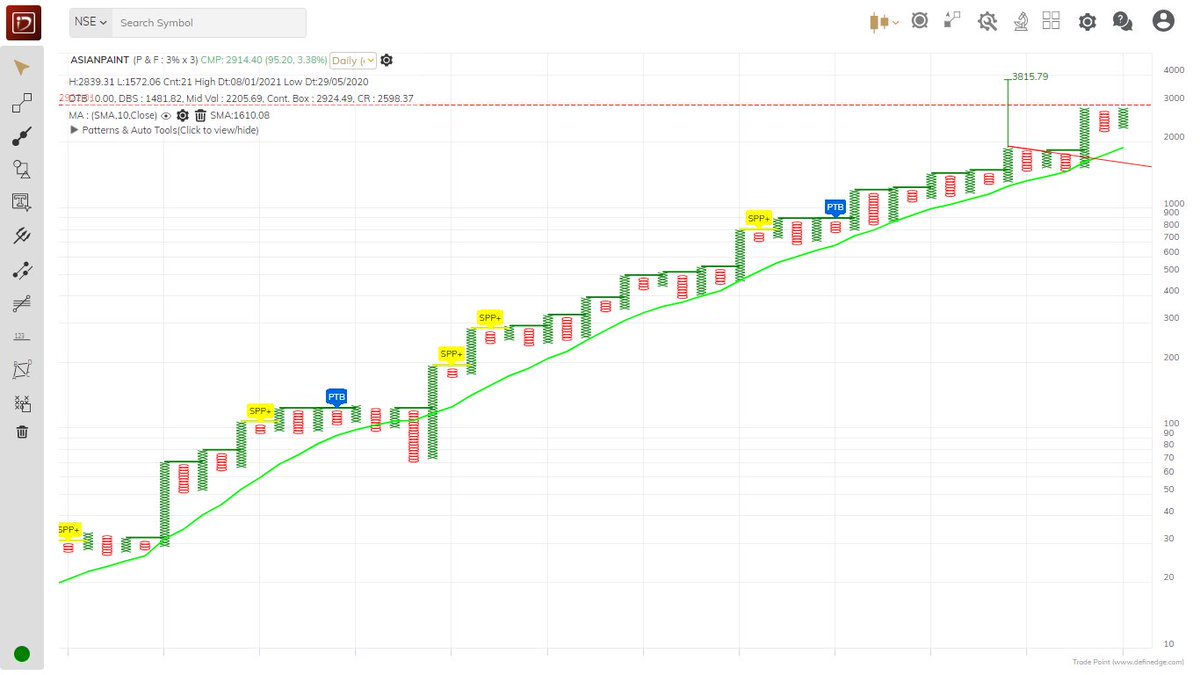
Double Top Buy & Super Pattern - Bullish above 4438.54 daily close on 1% Box Size chart. https://t.co/Wb09NZQNSD pic.twitter.com/GcR7PdCLwk
More from Saket Reddy

DEEPAKNTR
Double Top Buy & T20 Pattern - Bullish above 2189.89 daily close on 1% Box Size Chart. https://t.co/dEAqzILJj4
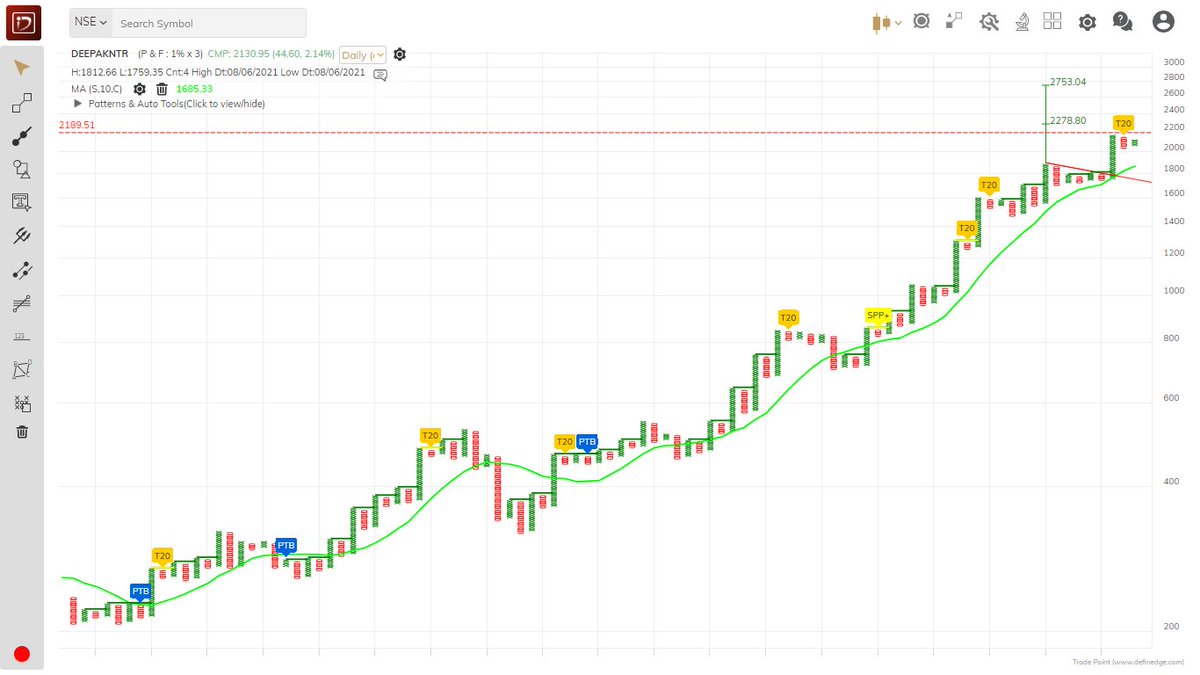
Double Top Buy & T20 Pattern - Bullish above 2189.89 daily close on 1% Box Size Chart. https://t.co/dEAqzILJj4
DEEPAKNTR
— Saket Reddy (@saketreddy) March 30, 2021
Double Top Buy & ABC Breakout above 1608.64 daily close on 1% Box size chart & Double Top Buy active on 3% Box size chart.
2000 Coming! https://t.co/ifywtsGM0S pic.twitter.com/VM7TneVwOr


More from Tataelxsi

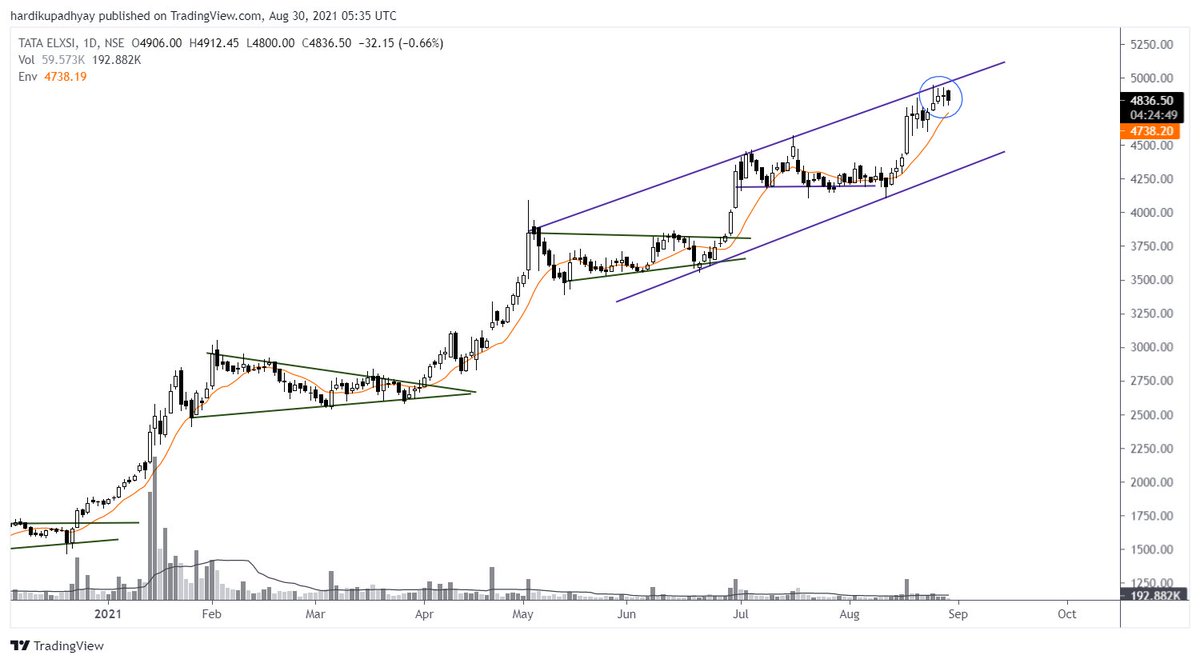


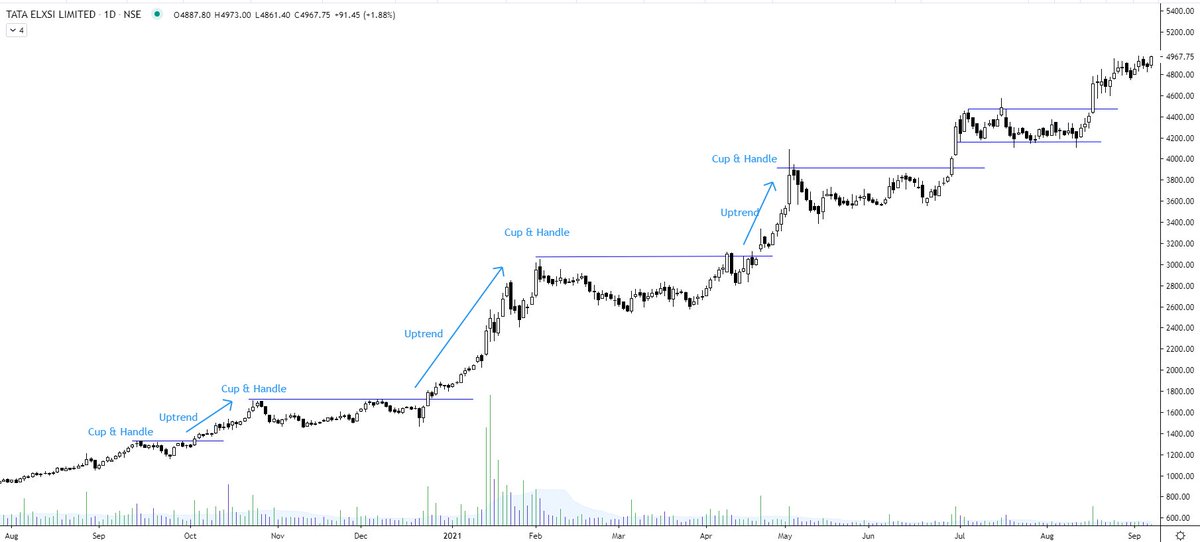
Tata Elxsi - IH&S continuation breakout done.
Target opened as per the pattern is 8900 https://t.co/nRqYqPnPB3
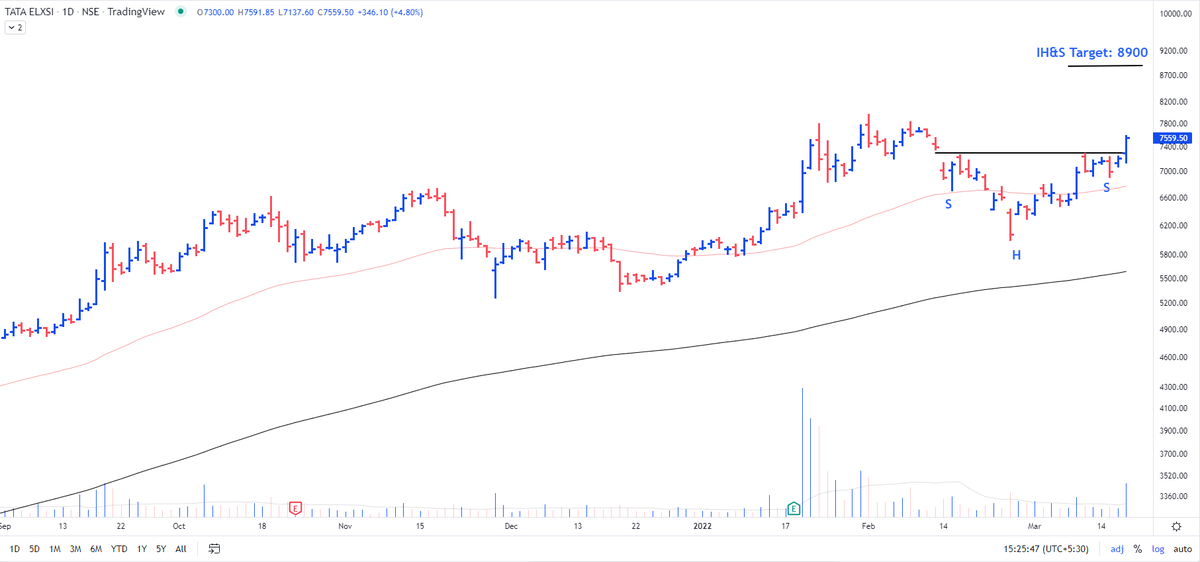
Target opened as per the pattern is 8900 https://t.co/nRqYqPnPB3
Tata Elxsi - I waited for the trigger today but to no avail. The setup is still the best with price consolidating right in the RS zone. Waiting for the breakout till then no action. pic.twitter.com/LnOPswWgAp
— The_Chartist \U0001f4c8 (@charts_zone) March 16, 2022

You May Also Like


1/OK, data mystery time.
This New York Times feature shows China with a Gini Index of less than 30, which would make it more equal than Canada, France, or the Netherlands. https://t.co/g3Sv6DZTDE
That's weird. Income inequality in China is legendary.
Let's check this number.
2/The New York Times cites the World Bank's recent report, "Fair Progress? Economic Mobility across Generations Around the World".
The report is available here:
3/The World Bank report has a graph in which it appears to show the same value for China's Gini - under 0.3.
The graph cites the World Development Indicators as its source for the income inequality data.
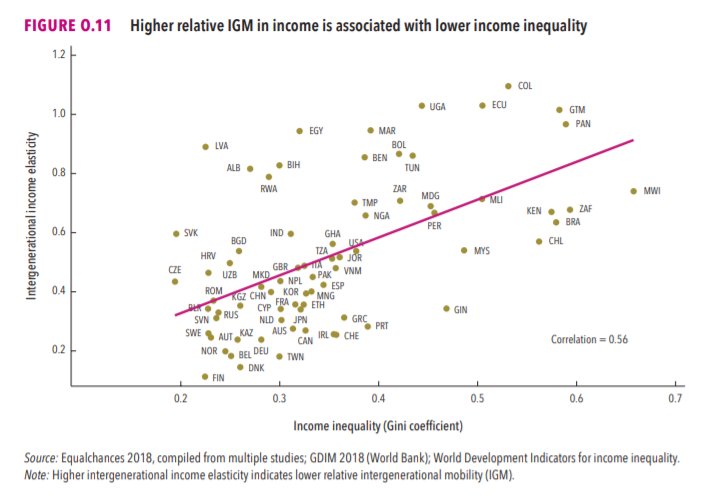
4/The World Development Indicators are available at the World Bank's website.
Here's the Gini index: https://t.co/MvylQzpX6A
It looks as if the latest estimate for China's Gini is 42.2.
That estimate is from 2012.
5/A Gini of 42.2 would put China in the same neighborhood as the U.S., whose Gini was estimated at 41 in 2013.
I can't find the <30 number anywhere. The only other estimate in the tables for China is from 2008, when it was estimated at 42.8.
This New York Times feature shows China with a Gini Index of less than 30, which would make it more equal than Canada, France, or the Netherlands. https://t.co/g3Sv6DZTDE
That's weird. Income inequality in China is legendary.
Let's check this number.
2/The New York Times cites the World Bank's recent report, "Fair Progress? Economic Mobility across Generations Around the World".
The report is available here:
3/The World Bank report has a graph in which it appears to show the same value for China's Gini - under 0.3.
The graph cites the World Development Indicators as its source for the income inequality data.
4/The World Development Indicators are available at the World Bank's website.
Here's the Gini index: https://t.co/MvylQzpX6A
It looks as if the latest estimate for China's Gini is 42.2.
That estimate is from 2012.
5/A Gini of 42.2 would put China in the same neighborhood as the U.S., whose Gini was estimated at 41 in 2013.
I can't find the <30 number anywhere. The only other estimate in the tables for China is from 2008, when it was estimated at 42.8.