
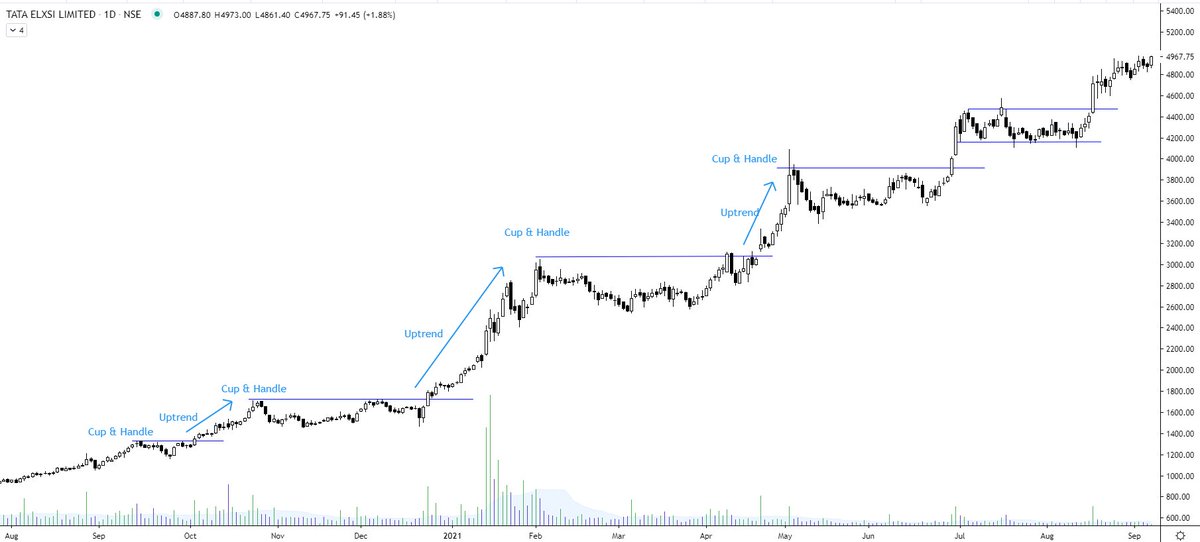
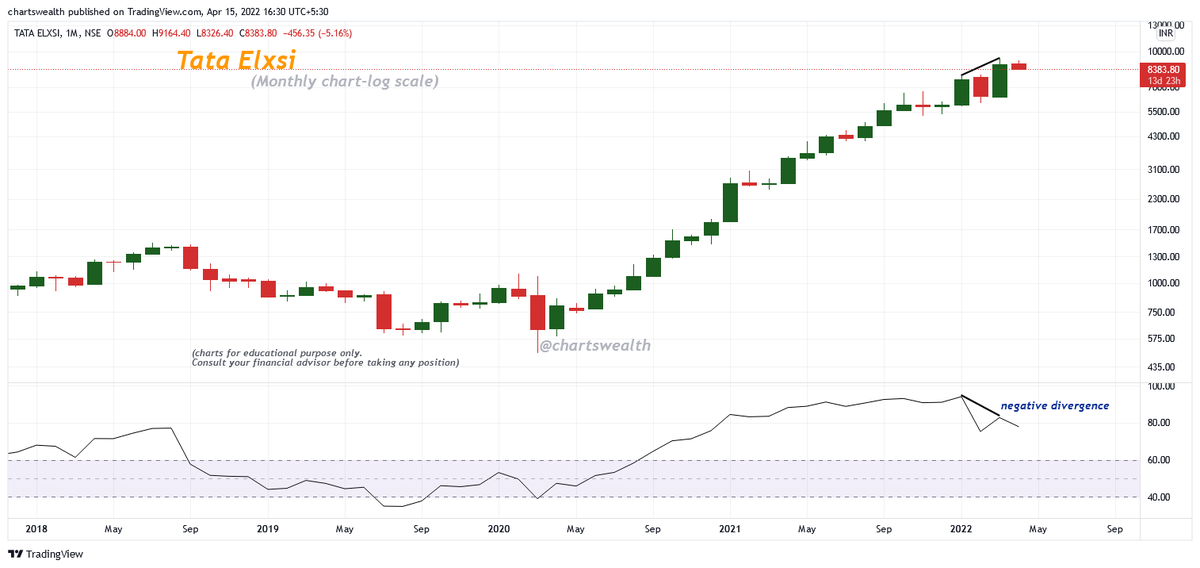
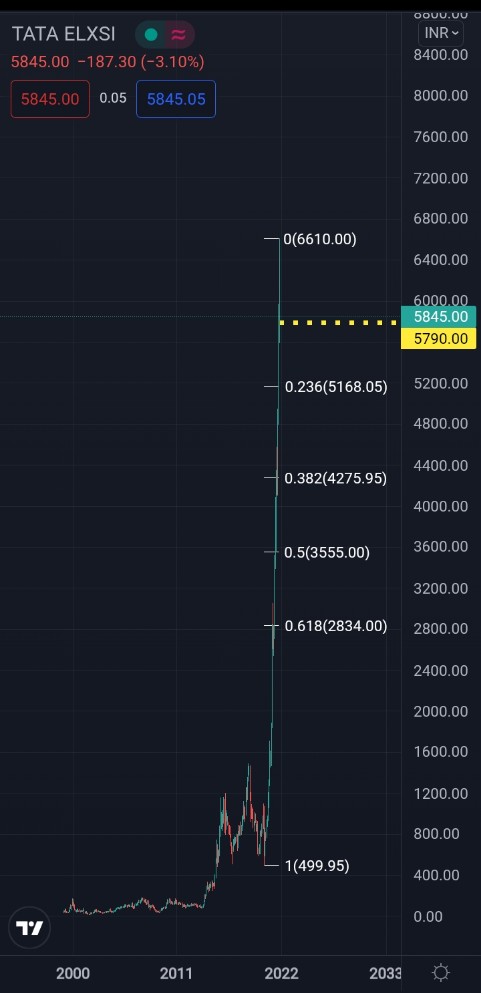
Tata Elxsi @ 500 - Gann theorist ( Target: 250)
@ 900 - Auto sector slowdown
@ 1500 - overvalued
@ 2500 - PE is extremely high
@ 3500 - other options avaialble
@ 4500 - market is insane
Heading to 5000 - will hear the new narrative.
The market is an interesting place to watch.
More from The_Chartist 📈
I believe 5-10 stocks are enough for a retail investor to achieve super performance. And with small capital, there is no point in buying 20/30 names which doesn't even get appropriate initial capital.
Stock: CDSL
— Steve Nison (@nison_steve) December 16, 2020
CMP - 516.95. Low risk setup. Weak below 500. Target open. Stock retesting the ascending triangle BO line. Kindly check please. @nishkumar1977 @Rishikesh_ADX @VijayThk @kuttrapali @Thekalal @PAVLeader pic.twitter.com/PlcpOMsdnz
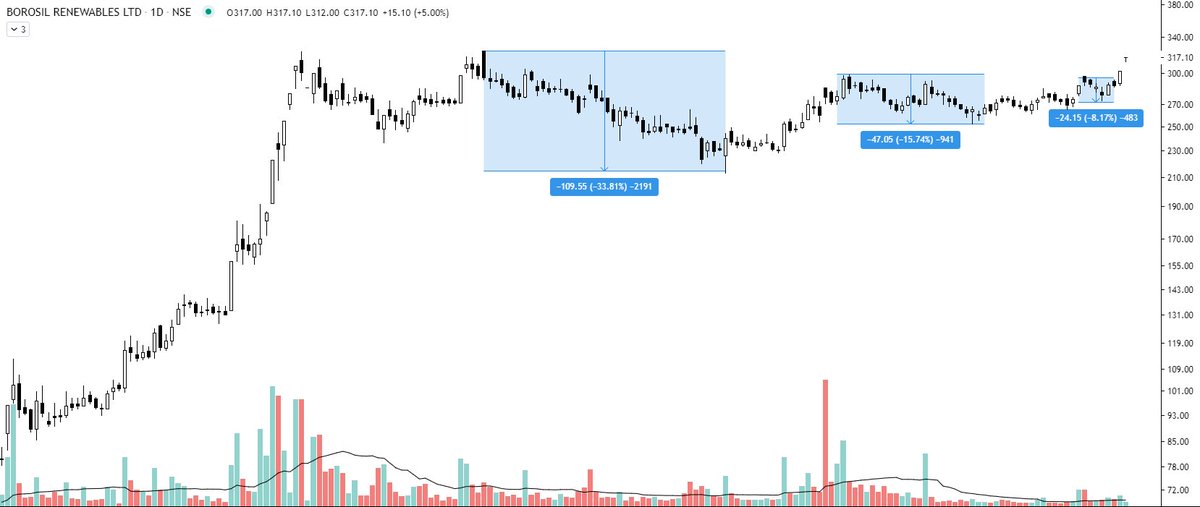
Borosil Renewables - Patterns like these must be looked at carefully and must be kept on the radar. Herein price is contracting which generally signifies shifting of hands (from weak to strong). If you go wrong, the risk is limited in these. pic.twitter.com/iqyoeslZjy
— Steve Nison (@nison_steve) July 12, 2021
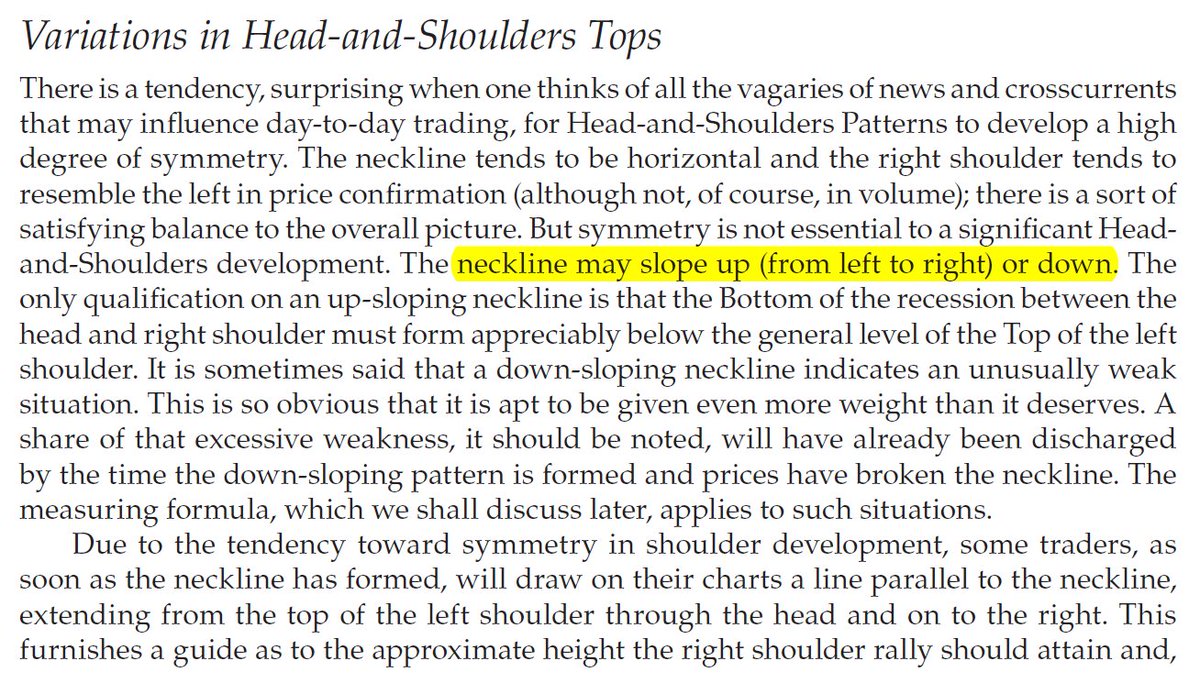
Sir Edwards & Magee discussed sloping necklines in H&S in their classical work. I am considering this breakdown by Affle as an H&S top breakdown with a target open of 770.
— The_Chartist \U0001f4c8 (@charts_zone) May 25, 2022
The target also coincides with support at the exact same level. pic.twitter.com/n84kSgkg4q
USDINR - a breakout that will not bode well for the equities
78+ https://t.co/AWqZxF5B1L
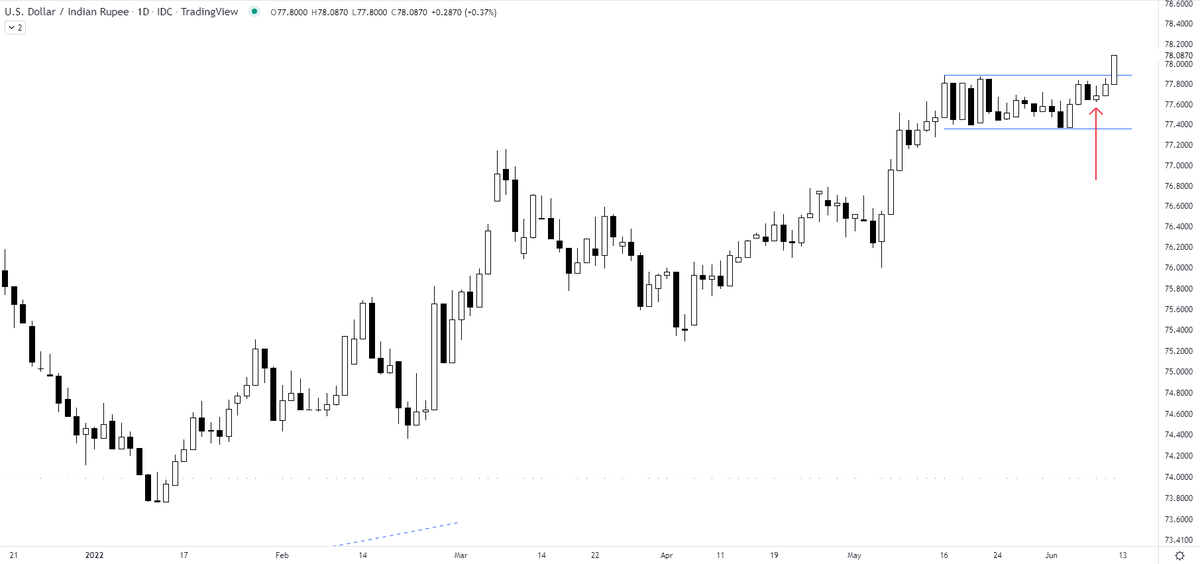
Can you anticipate a breakout? Yes
— The_Chartist \U0001f4c8 (@charts_zone) June 10, 2022
the attached tweet.
now the chart is for USDINR https://t.co/Vb2wKaCvTB pic.twitter.com/INo0GC4fGY
More from Tataelxsi


You May Also Like


Unfortunately the "This work includes the identification of viral sequences in bat samples, and has resulted in the isolation of three bat SARS-related coronaviruses that are now used as reagents to test therapeutics and vaccines." were BEFORE the

chimeric infectious clone grants were there.https://t.co/DAArwFkz6v is in 2017, Rs4231.
https://t.co/UgXygDjYbW is in 2016, RsSHC014 and RsWIV16.
https://t.co/krO69CsJ94 is in 2013, RsWIV1. notice that this is before the beginning of the project
starting in 2016. Also remember that they told about only 3 isolates/live viruses. RsSHC014 is a live infectious clone that is just as alive as those other "Isolates".
P.D. somehow is able to use funds that he have yet recieved yet, and send results and sequences from late 2019 back in time into 2015,2013 and 2016!
https://t.co/4wC7k1Lh54 Ref 3: Why ALL your pangolin samples were PCR negative? to avoid deep sequencing and accidentally reveal Paguma Larvata and Oryctolagus Cuniculus?

