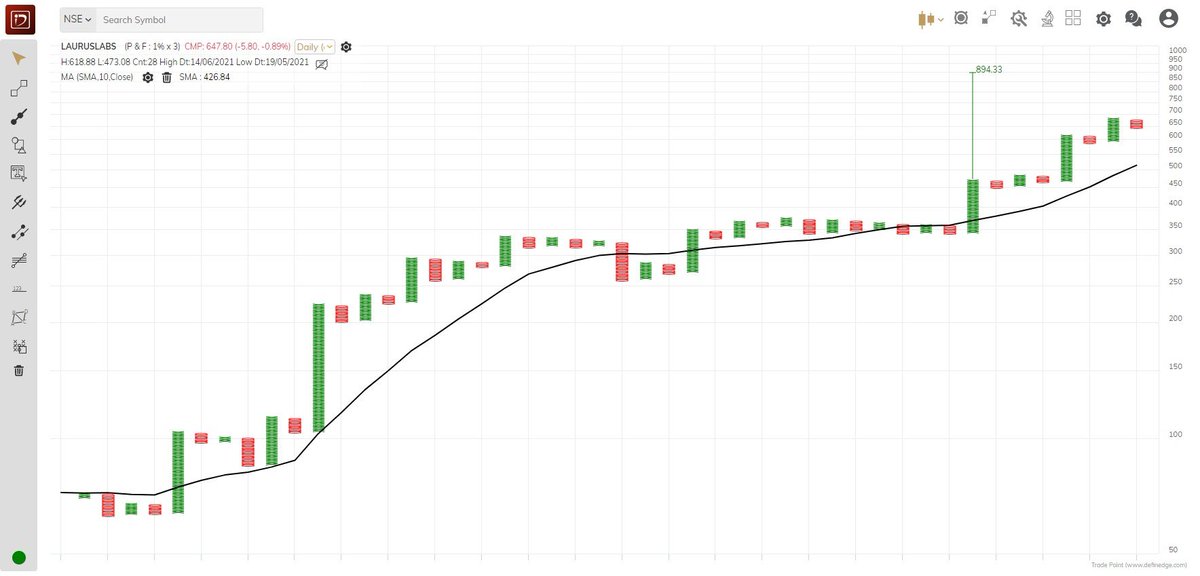
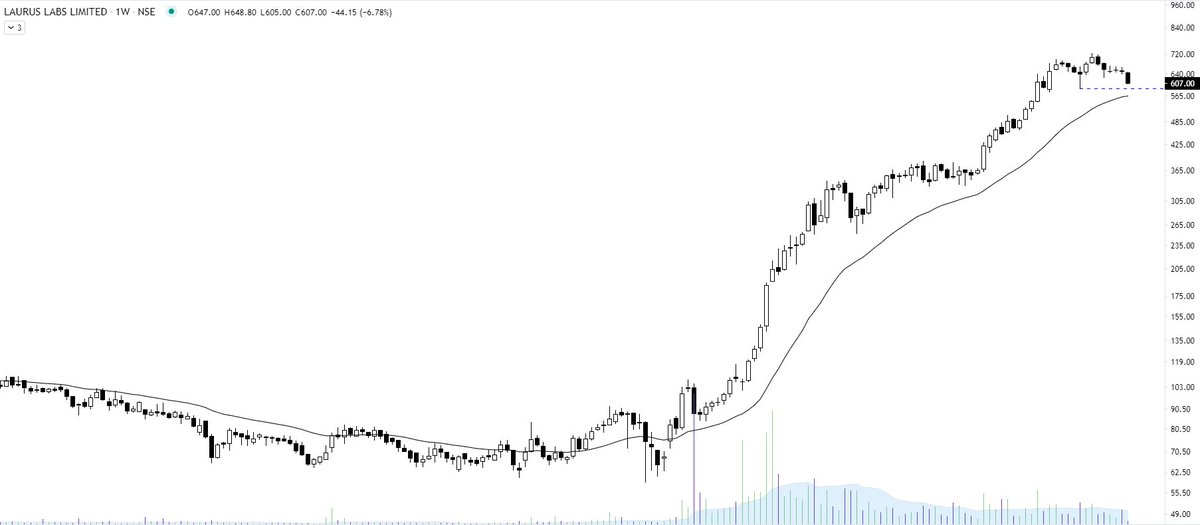
Borosil renewables - Enter if you can. Read the below tweet to understand the concept. The only way you can make money is to follow in the footsteps of smart money till you yourself become a smart operator. 👇👇 https://t.co/RN8sQYzdBg
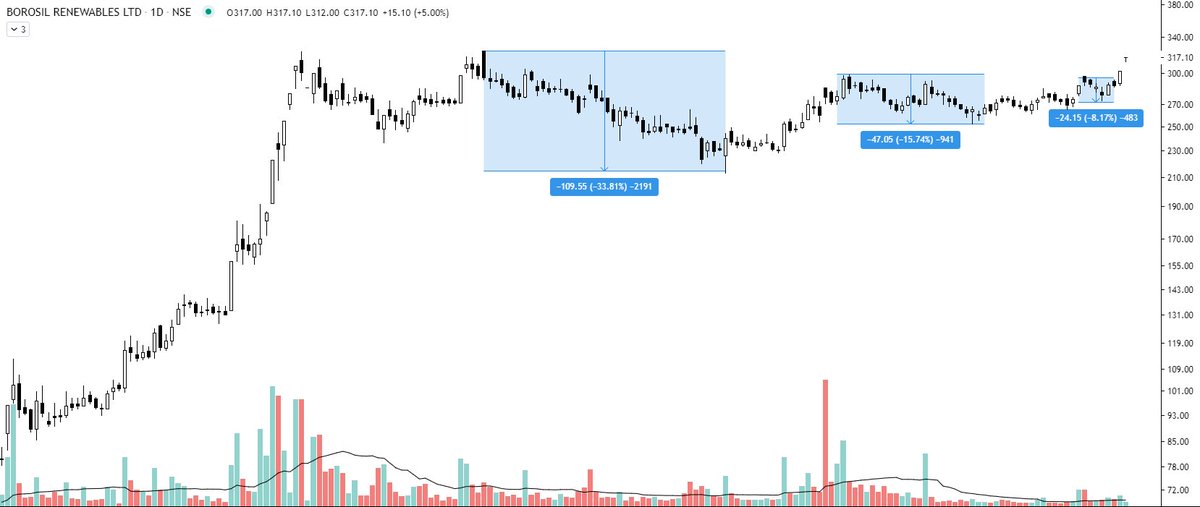
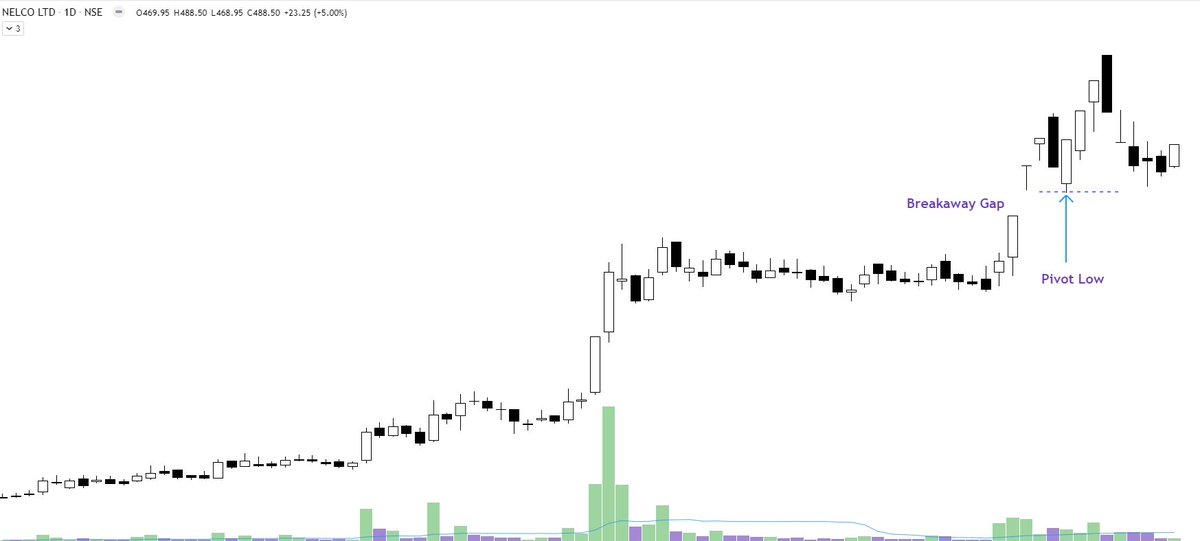
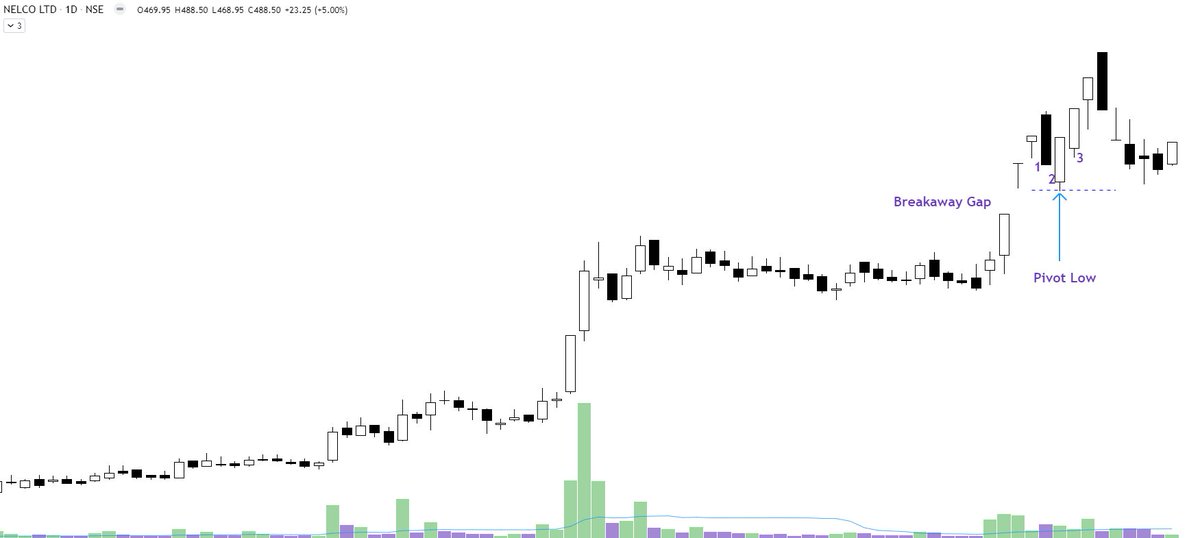
Borosil Renewables - Patterns like these must be looked at carefully and must be kept on the radar. Herein price is contracting which generally signifies shifting of hands (from weak to strong). If you go wrong, the risk is limited in these. pic.twitter.com/iqyoeslZjy
— Steve Nison (@nison_steve) July 12, 2021
More from Steve Nison

Nifty Private Bank https://t.co/BwG1DKhhLc
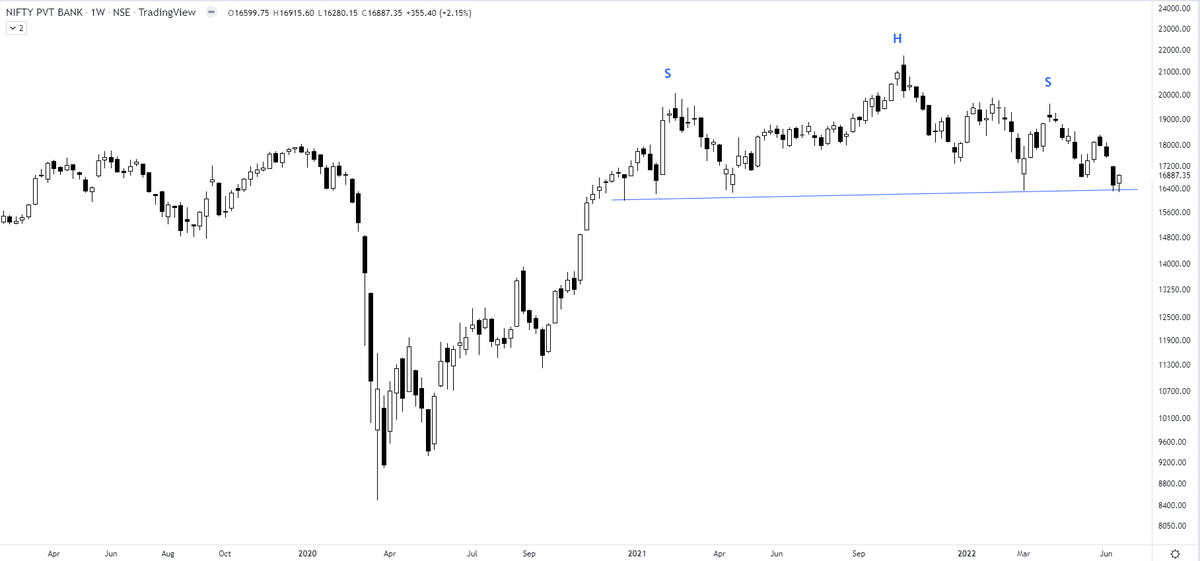
I am watching a big bearish H&S top building up in Nifty Private Bank Index. Any breakdown will result in increased volatility in respective charts. For traders - definitely not a spot to be in. The index has to move beyond 19900 to negate the pattern. pic.twitter.com/IGFeyNrtQV
— The_Chartist \U0001f4c8 (@charts_zone) June 19, 2022
You May Also Like


This New York Times feature shows China with a Gini Index of less than 30, which would make it more equal than Canada, France, or the Netherlands. https://t.co/g3Sv6DZTDE
That's weird. Income inequality in China is legendary.
Let's check this number.
2/The New York Times cites the World Bank's recent report, "Fair Progress? Economic Mobility across Generations Around the World".
The report is available here:
3/The World Bank report has a graph in which it appears to show the same value for China's Gini - under 0.3.
The graph cites the World Development Indicators as its source for the income inequality data.

4/The World Development Indicators are available at the World Bank's website.
Here's the Gini index: https://t.co/MvylQzpX6A
It looks as if the latest estimate for China's Gini is 42.2.
That estimate is from 2012.
5/A Gini of 42.2 would put China in the same neighborhood as the U.S., whose Gini was estimated at 41 in 2013.
I can't find the <30 number anywhere. The only other estimate in the tables for China is from 2008, when it was estimated at 42.8.

RT-PCR corona (test) scam
Symptomatic people are tested for one and only one respiratory virus. This means that other acute respiratory infections are reclassified as
4/10
— Dr. Thomas Binder, MD (@Thomas_Binder) October 22, 2020
...indication, first of all that testing for a (single) respiratory virus is done outside of surveillance systems or need for specific therapy, but even so the lack of consideration of Ct, symptoms and clinical findings when interpreting its result. https://t.co/gHH6kwRdZG
2/12
It is tested exquisitely with a hypersensitive non-specific RT-PCR test / Ct >35 (>30 is nonsense, >35 is madness), without considering Ct and clinical context. This means that more acute respiratory infections are reclassified as
6/10
— Dr. Thomas Binder, MD (@Thomas_Binder) October 22, 2020
The neither validated nor standardised hypersensitive RT-PCR test / Ct 35-45 for SARS-CoV-2 is abused to mislabel (also) other diseases, especially influenza, as COVID-19.https://t.co/AkFIfTCTkS
3/12
The Drosten RT-PCR test is fabricated in a way that each country and laboratory perform it differently at too high Ct and that the high rate of false positives increases massively due to cross-reaction with other (corona) viruses in the "flu
External peer review of the RTPCR test to detect SARS-CoV-2 reveals 10 major scientific flaws at the molecular and methodological level: consequences for false positive results.https://t.co/mbNY8bdw1p pic.twitter.com/OQBD4grMth
— Dr. Thomas Binder, MD (@Thomas_Binder) November 29, 2020
4/12
Even asymptomatic, previously called healthy, people are tested (en masse) in this way, although there is no epidemiologically relevant asymptomatic transmission. This means that even healthy people are declared as COVID
Thread web\u2b06\ufe0f\u2b07\ufe0f
— Dr. Thomas Binder, MD (@Thomas_Binder) December 16, 2020
The fabrication of the "asymptomatic (super) spreader" is the coronation of the total nons(ci)ense in the belief system of #CoronasWitnesses.
Asymptomatic transmission 0.7%; 95% CI 0%-4.9% - could well be 0%!https://t.co/VeZTzxXfvT
5/12
Deaths within 28 days after a positive RT-PCR test from whatever cause are designated as deaths WITH COVID. This means that other causes of death are reclassified as
8/8
— Dr. Thomas Binder, MD (@Thomas_Binder) March 24, 2020
By the way, who the f*** created this obviously (almost) worldwide definition of #CoronaDeath?
This is not only medical malpractice, this is utterly insane!https://t.co/FFsTx4L2mw