TATAELXSI
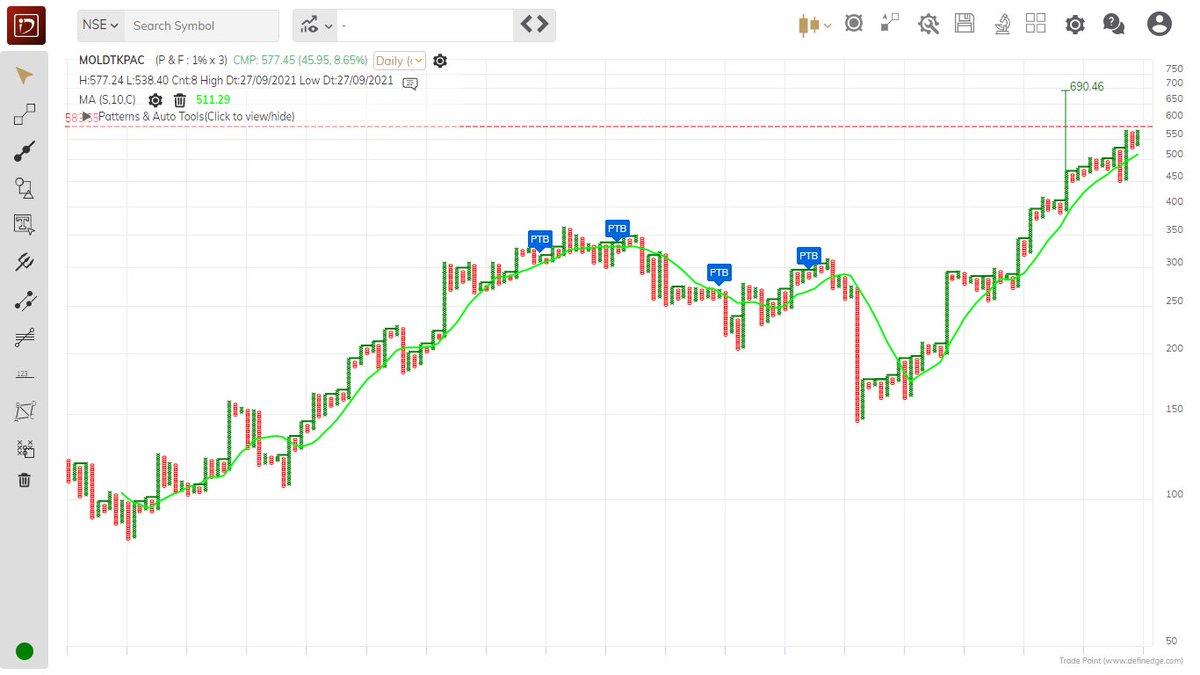
Double Top Buy above 3861.36 daily close on 1% Box size chart. https://t.co/WT41aJz6wK
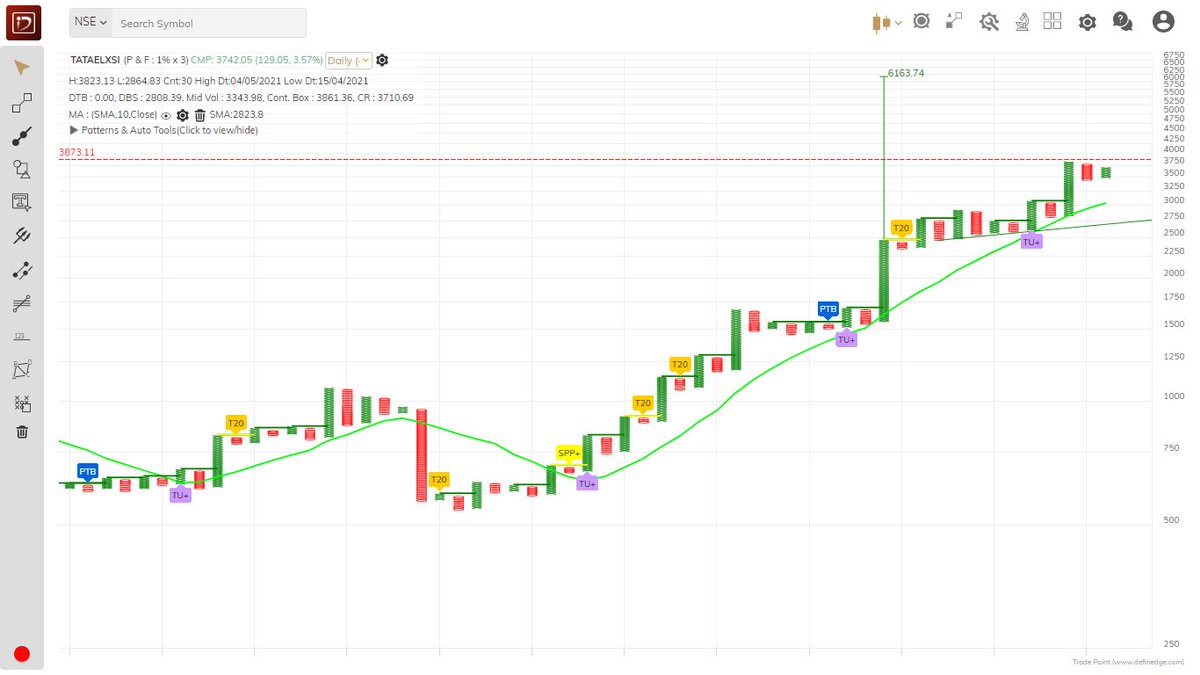
TATAELXSI
— Saket Reddy (@saketreddy) April 9, 2021
Double Top Buy above 3012.22 daily close on 3% Box size chart. https://t.co/YnFc9kGpQ7 pic.twitter.com/h1obHNBWrl
More from Saket Reddy

More from Tataelxsi


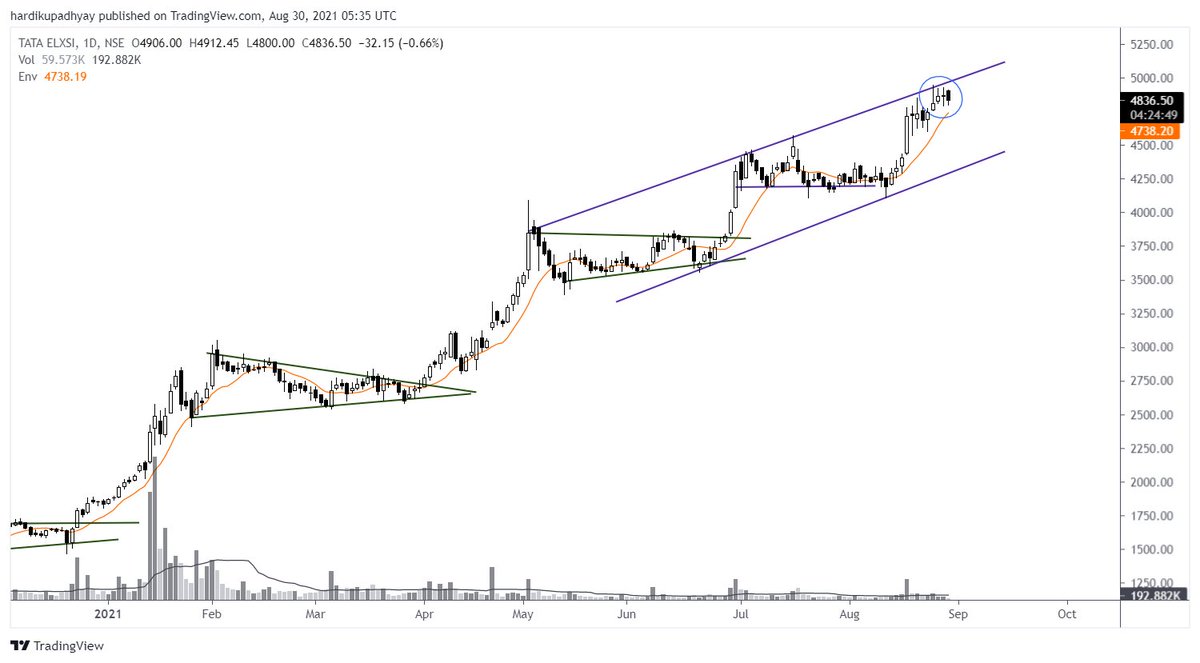



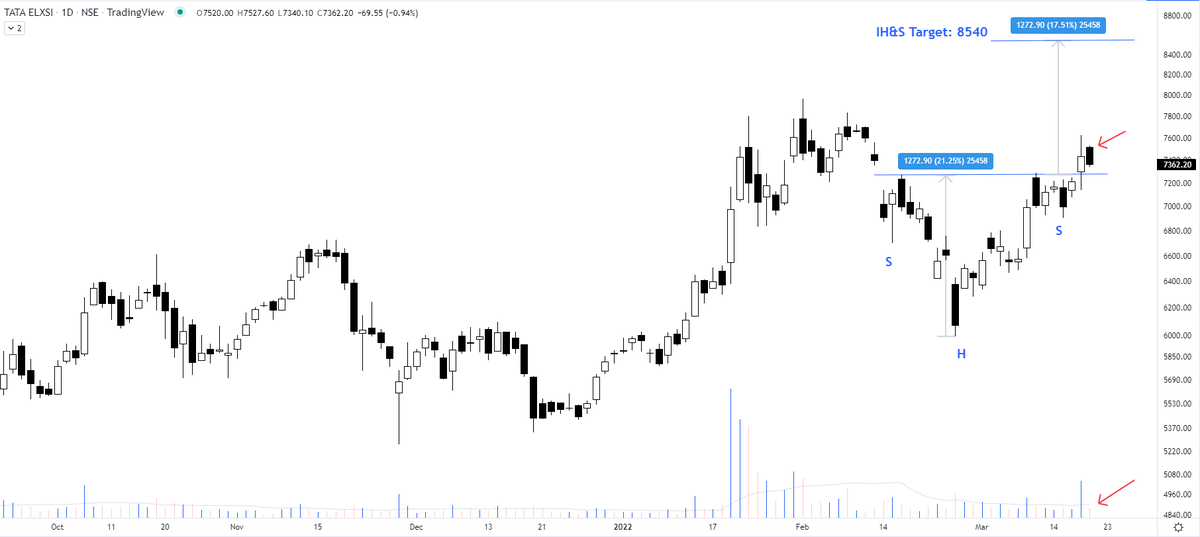
these low-volume pullbacks after the breakout are a common occurrence. However, what is more, important is the stock's reaction after a pullback. It must bounce back within a few sessions strongly to scale up the size.
Tata Elxsi https://t.co/HGCzOz1ALI
Tata Elxsi https://t.co/HGCzOz1ALI
Correction \U0001f447
— The_Chartist \U0001f4c8 (@charts_zone) March 20, 2022
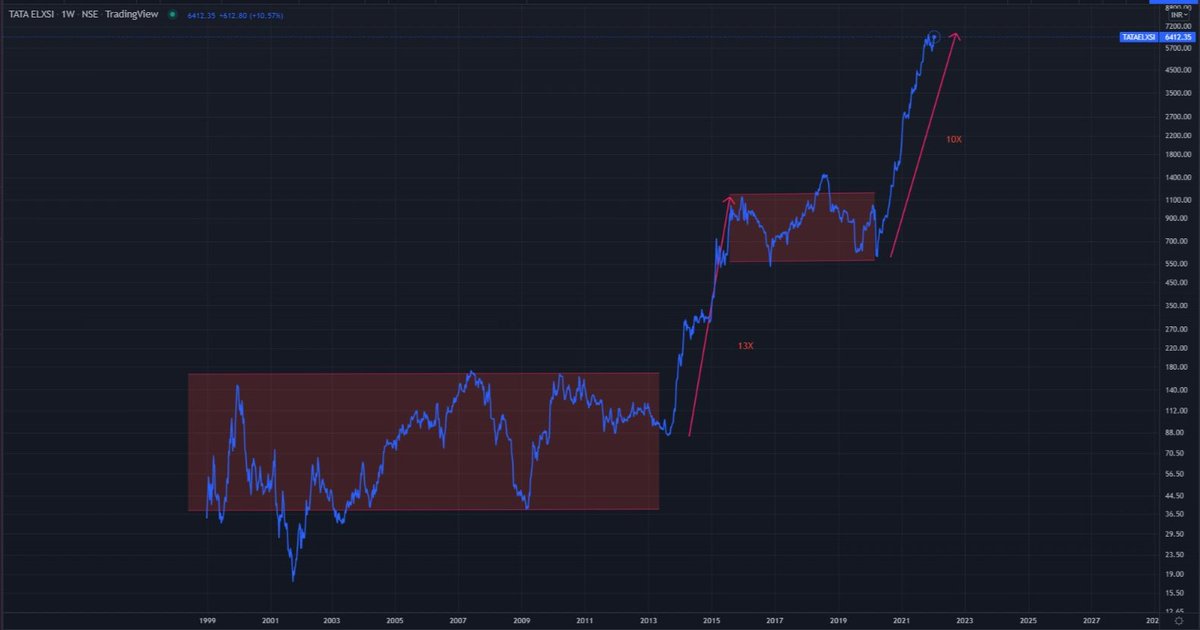
During upward breakouts, I have to consider price targets and not %age targets. Therefore the target comes out to be 8540 and not 8900 as mentioned before.
The chart stands updated.
Tata Elxsi https://t.co/sdP9X1s9qs pic.twitter.com/Gmhn3OYiNA
You May Also Like










THREAD PART 1.
On Sunday 21st June, 14 year old Noah Donohoe left his home to meet his friends at Cave Hill Belfast to study for school. #RememberMyNoah💙
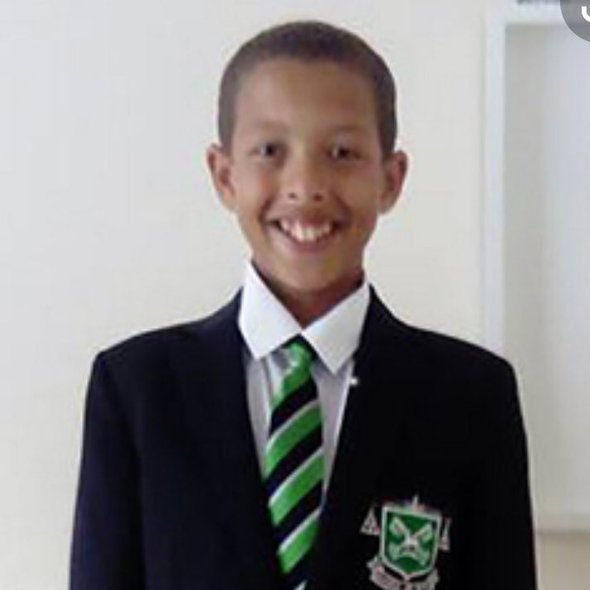
He was on his black Apollo mountain bike, fully dressed, wearing a helmet and carrying a backpack containing his laptop and 2 books with his name on them. He also had his mobile phone with him.
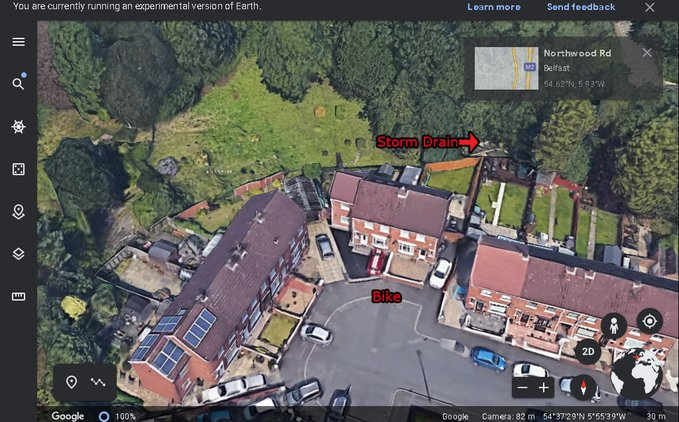
On the 27th of June. Noah's naked body was sadly discovered 950m inside a storm drain, between access points. This storm drain was accessible through an area completely unfamiliar to him, behind houses at Northwood Road. https://t.co/bpz3Rmc0wq
"Noah's body was found by specially trained police officers between two drain access points within a section of the tunnel running under the Translink access road," said Mr McCrisken."
Noah's bike was also found near a house, behind a car, in the same area. It had been there for more than 24 hours before a member of public who lived in the street said she read reports of a missing child and checked the bike and phoned the police.
On Sunday 21st June, 14 year old Noah Donohoe left his home to meet his friends at Cave Hill Belfast to study for school. #RememberMyNoah💙
He was on his black Apollo mountain bike, fully dressed, wearing a helmet and carrying a backpack containing his laptop and 2 books with his name on them. He also had his mobile phone with him.
On the 27th of June. Noah's naked body was sadly discovered 950m inside a storm drain, between access points. This storm drain was accessible through an area completely unfamiliar to him, behind houses at Northwood Road. https://t.co/bpz3Rmc0wq
"Noah's body was found by specially trained police officers between two drain access points within a section of the tunnel running under the Translink access road," said Mr McCrisken."
Noah's bike was also found near a house, behind a car, in the same area. It had been there for more than 24 hours before a member of public who lived in the street said she read reports of a missing child and checked the bike and phoned the police.