Forgot to mention one point. How to trail profits in Breakout trades.
One of the best way that I know is ATR based trailing.
Here is an example https://t.co/BTATx5fyW6
An example of ATR based TSL.
— Professor (@DillikiBiili) April 9, 2021
SL for coming candle is Low of the just completed candle - ATR of previous candle. Chart is self explanatory. https://t.co/D95iv4t5j6 pic.twitter.com/e8BkO2j5rn
More from Professor
It has string resistance at 3200, so fresh up-move will be confirmed only when it opens above 3220-3230 levels
#ASIANPAINT
#DKBPositional https://t.co/Q6fTbK5VHM
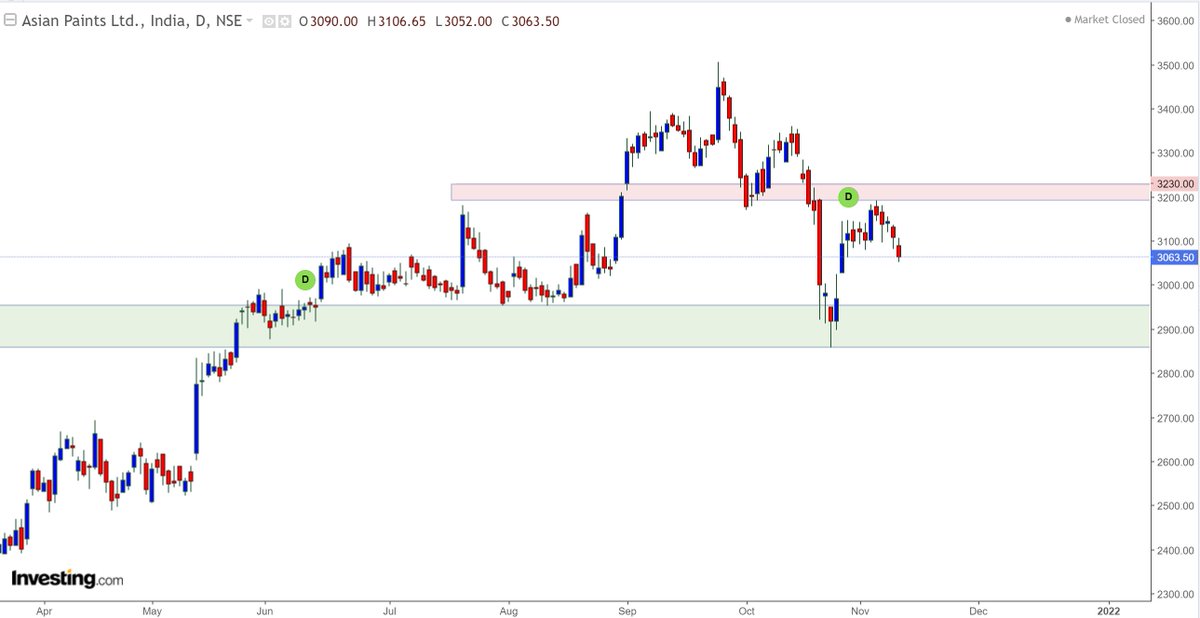
Asian Paints also at crucial support line, bulls desperately need a reversal here, else it'll go in hibernation..... pic.twitter.com/VTfaMfpHXs
— Professor (@DillikiBiili) October 21, 2021
One Chadarmod on timeline posted that I’m giving gyan without having experience or expertise.
So I’ll begin with paying my portfolio performance tribute to these charlies.
https://t.co/GNM5SsNFNo
Sadda Haqq ! Aithe Rakhh......... pic.twitter.com/IH5q3v2gw9
— Professor (@DillikiBiili) October 5, 2021
Fundamentals based investing can generate serious wealth as the most famous (rather infamous) Warren Buffett has shown.
In India also we have many success stories like @VijayKedia1 @Raamdeo R K Damani Rakesh Jhunjhunwala Late Chandrakant Sampat and many many more....
Though I can't stop mentioning that both Rakesh Jhunjhunwala and R K Damani were traders in their initial days.
Rakesh Jhunjhunwala still trades, he once said Traing is fun, its le fatafat, de fatafat
A lot of people (specially the beginners) buy stocks based on some friend's recommendation : XYZ le le, pukka chalega, maine bhi le rakha hai.
Few might have made money this way, but most do not. Why ?
There has to be a process.
Fundamentals based investing need thorough analysis of the Business & Company.
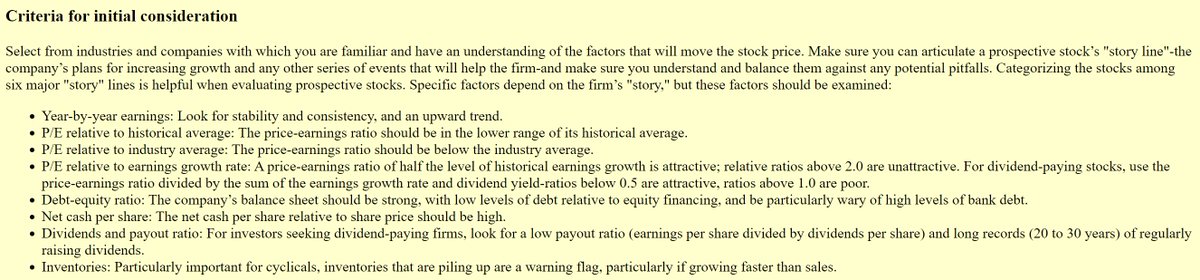
Here is a preliminary checklist by the legendary investor Peter lynch

More from Stoploss


This is the reason for retailers stoploss. Check it out \U0001f447 https://t.co/fnHPgzCCVn pic.twitter.com/njvqgM9PI3
— Learn to Trade (@learntotrade365) July 28, 2021

Read and follow this.. he has aptly explained about various methods to trail.
2. TRAILING METHODS-
— Trader knight (@Traderknight007) December 24, 2020
1. SWING POINT METHOD-
In this method we use the swing points or the HH- HL OR LH-LL points for placing sl,
In this method we trail our sl when the stock make a Higher low after our entry and keep Trailing the sl till it hits. pic.twitter.com/CqzCkLdWmC