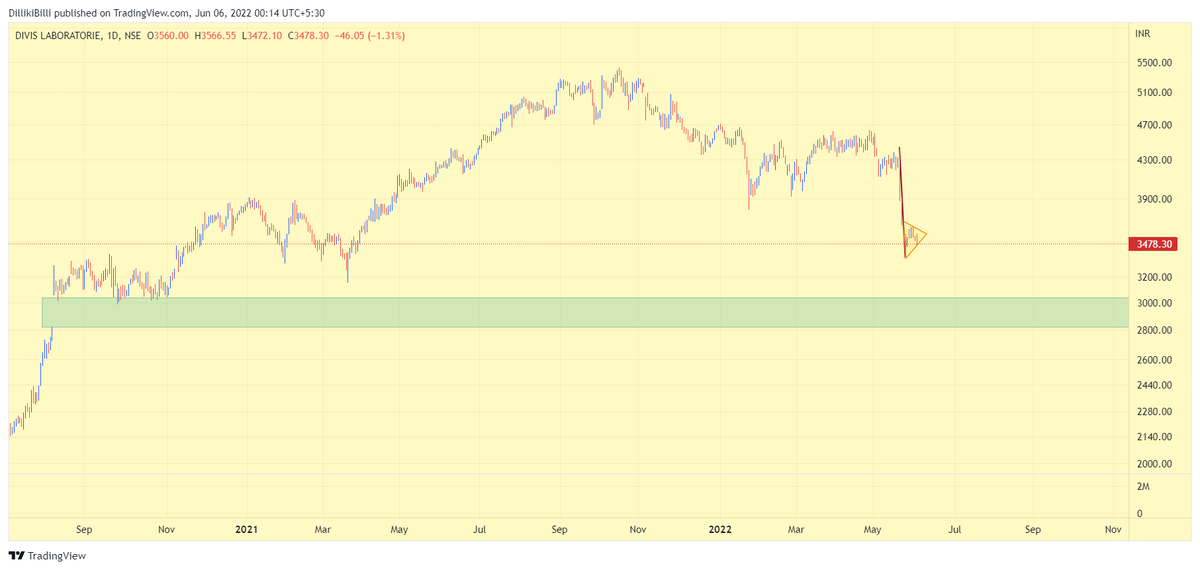
For finding potential breakout candidates, you may run this scanner daily EOD, whenever any new candidate props up, check its chart for signs of breakout.
You may modify & fine tune this as per your own criteria like adding RSI or ADX or other indicators. https://t.co/FdiPG1c4s0
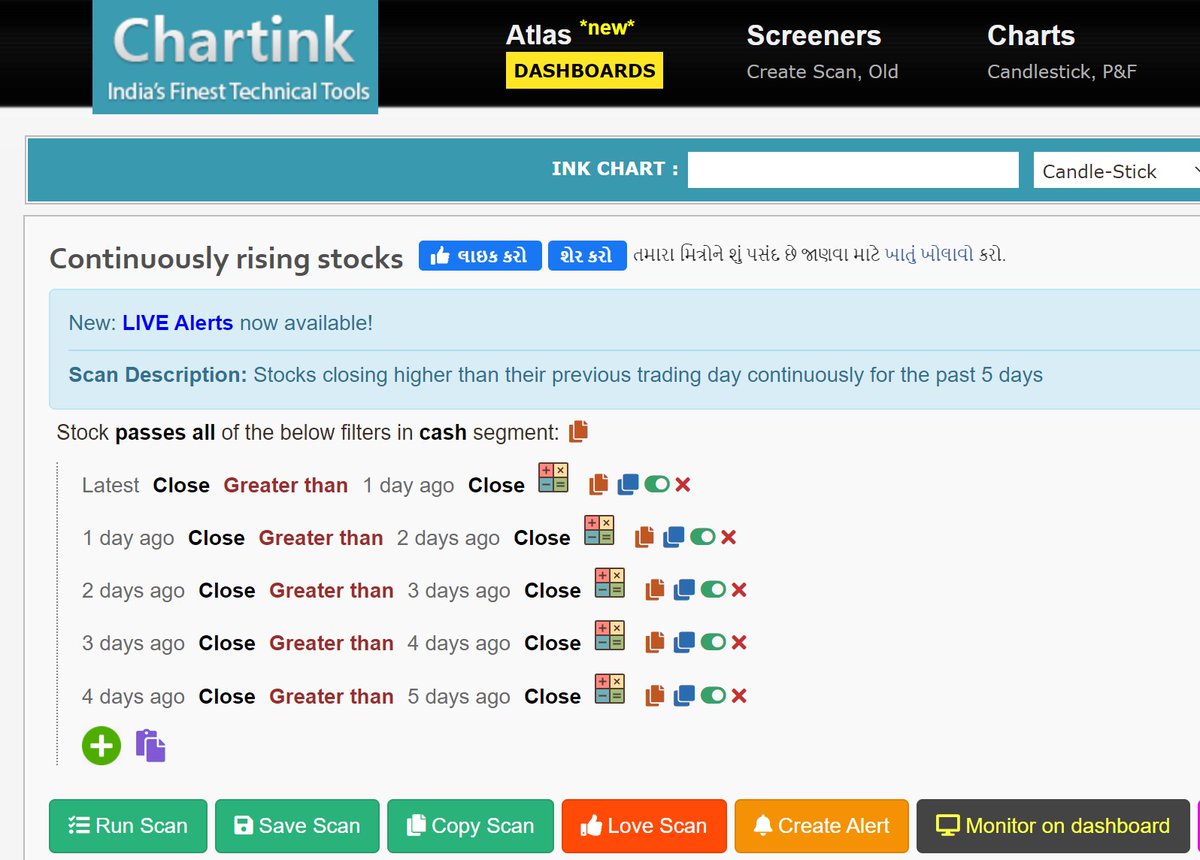
Bhai, can you please educate us, how do you find the breakout stocks? I mean which scanner? Any inputs would be much helpful.
— Loyalty Respect (@Novicetrader99) October 1, 2021
More from Professor
Starting the Beginner’s Pathway thread for Fundamental Investing.
One Chadarmod on timeline posted that I’m giving gyan without having experience or expertise.
So I’ll begin with paying my portfolio performance tribute to these charlies.
https://t.co/GNM5SsNFNo
Fundamentals based investing can generate serious wealth as the most famous (rather infamous) Warren Buffett has shown.
In India also we have many success stories like @VijayKedia1 @Raamdeo R K Damani Rakesh Jhunjhunwala Late Chandrakant Sampat and many many more....
Though I can't stop mentioning that both Rakesh Jhunjhunwala and R K Damani were traders in their initial days.
Rakesh Jhunjhunwala still trades, he once said Traing is fun, its le fatafat, de fatafat
A lot of people (specially the beginners) buy stocks based on some friend's recommendation : XYZ le le, pukka chalega, maine bhi le rakha hai.
Few might have made money this way, but most do not. Why ?
There has to be a process.
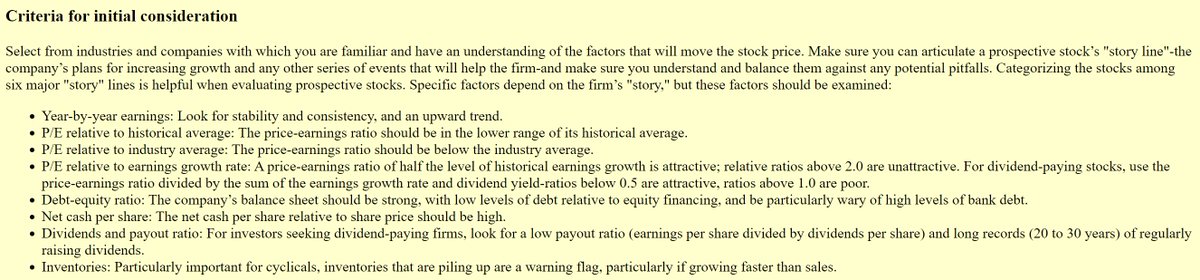
Fundamentals based investing need thorough analysis of the Business & Company.
Here is a preliminary checklist by the legendary investor Peter lynch
One Chadarmod on timeline posted that I’m giving gyan without having experience or expertise.
So I’ll begin with paying my portfolio performance tribute to these charlies.
https://t.co/GNM5SsNFNo
Sadda Haqq ! Aithe Rakhh......... pic.twitter.com/IH5q3v2gw9
— Professor (@DillikiBiili) October 5, 2021
Fundamentals based investing can generate serious wealth as the most famous (rather infamous) Warren Buffett has shown.
In India also we have many success stories like @VijayKedia1 @Raamdeo R K Damani Rakesh Jhunjhunwala Late Chandrakant Sampat and many many more....
Though I can't stop mentioning that both Rakesh Jhunjhunwala and R K Damani were traders in their initial days.
Rakesh Jhunjhunwala still trades, he once said Traing is fun, its le fatafat, de fatafat
A lot of people (specially the beginners) buy stocks based on some friend's recommendation : XYZ le le, pukka chalega, maine bhi le rakha hai.
Few might have made money this way, but most do not. Why ?
There has to be a process.
Fundamentals based investing need thorough analysis of the Business & Company.
Here is a preliminary checklist by the legendary investor Peter lynch
Forgot to mention one point. How to trail profits in Breakout trades.
One of the best way that I know is ATR based trailing.
Here is an example https://t.co/BTATx5fyW6
One of the best way that I know is ATR based trailing.
Here is an example https://t.co/BTATx5fyW6
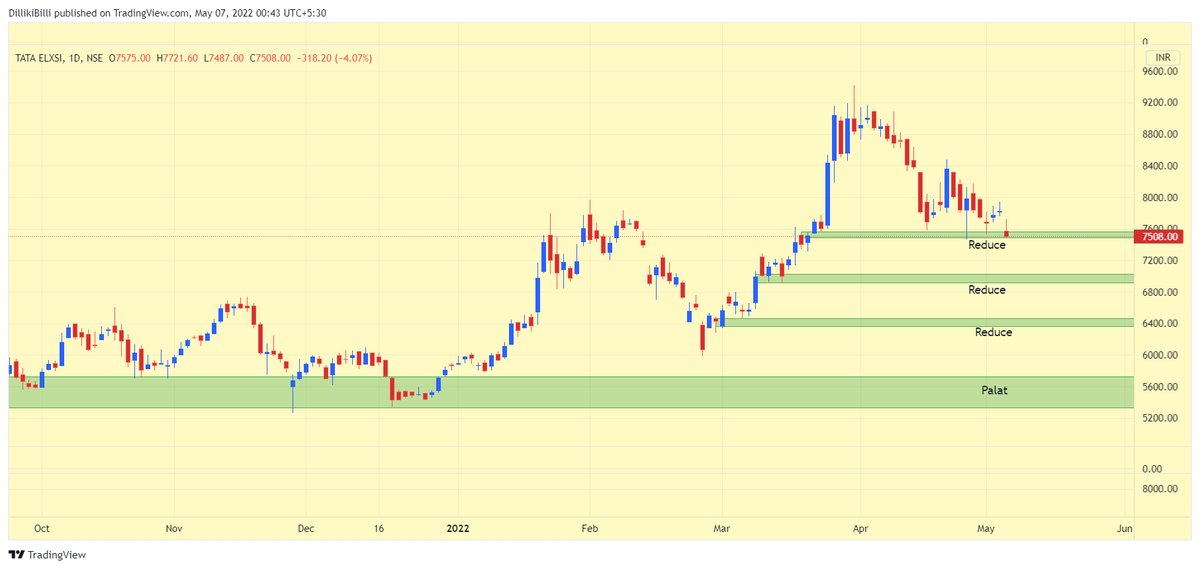
An example of ATR based TSL.
— Professor (@DillikiBiili) April 9, 2021
SL for coming candle is Low of the just completed candle - ATR of previous candle. Chart is self explanatory. https://t.co/D95iv4t5j6 pic.twitter.com/e8BkO2j5rn
More from Screeners


Such opportunities only come once in a few years.
Step-by-step: how to use (the free) @screener_in to generate investment ideas.
Do retweet if you find it useful to benefit max investors. 🙏🙏
Ready or not, 🧵🧵⤵️

I will use the free screener version so that everyone can follow along.
Outline
1. Stepwise Guide
2. Practical Example: CoffeeCan Companies
3. Practical Example: Smallcap Consistent compounders
4. Practical Example: Smallcap turnaround
5. Key Takeaway
1. Stepwise Guide
Step1
Go to https://t.co/jtOL2Bpoys
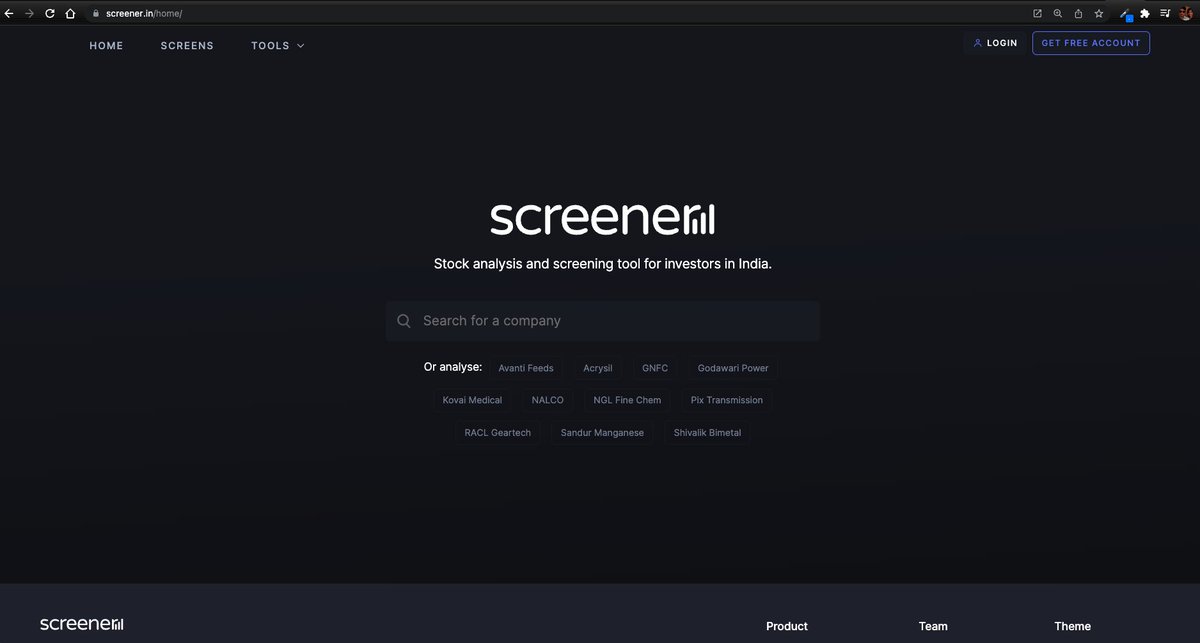
Step2
Go to "SCREENS" tab
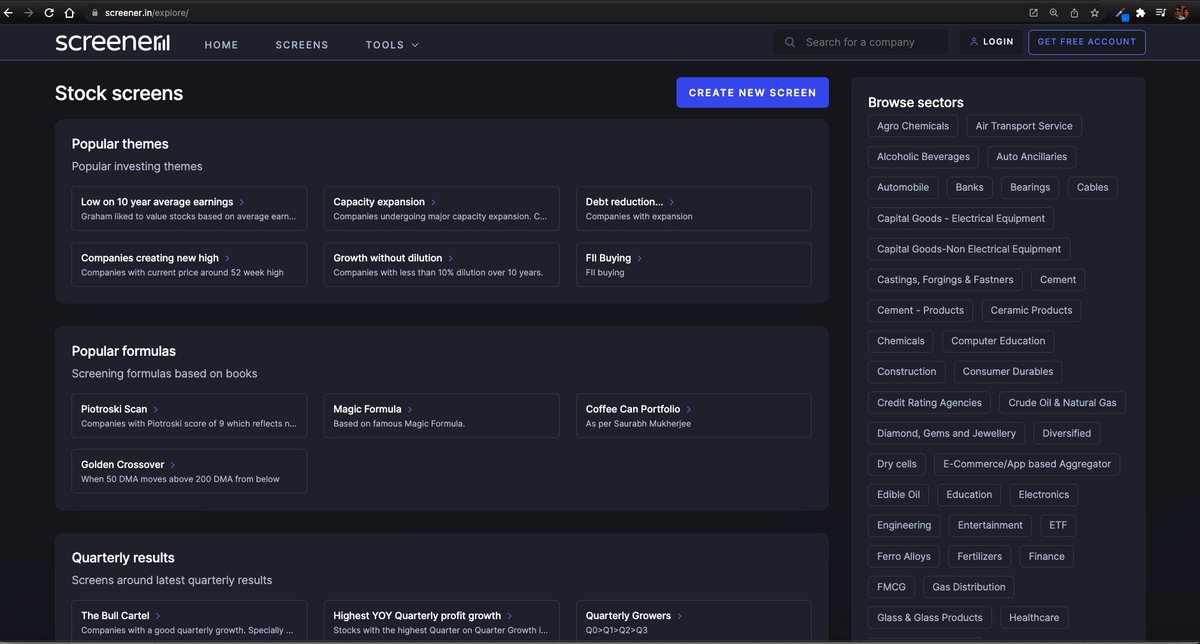
Step3
Go to "CREATE NEW SCREEN"
At this point you need to register. No charges. I did that with my brother's email id. This is what you see after that.

Step-by-step: how to use (the free) @screener_in to generate investment ideas.
Do retweet if you find it useful to benefit max investors. 🙏🙏
Ready or not, 🧵🧵⤵️
I will use the free screener version so that everyone can follow along.
Outline
1. Stepwise Guide
2. Practical Example: CoffeeCan Companies
3. Practical Example: Smallcap Consistent compounders
4. Practical Example: Smallcap turnaround
5. Key Takeaway
1. Stepwise Guide
Step1
Go to https://t.co/jtOL2Bpoys
Step2
Go to "SCREENS" tab
Step3
Go to "CREATE NEW SCREEN"
At this point you need to register. No charges. I did that with my brother's email id. This is what you see after that.


Time for a new thread on the possibilities I am looking for.
Do read it completely to understand the stance and the plan.
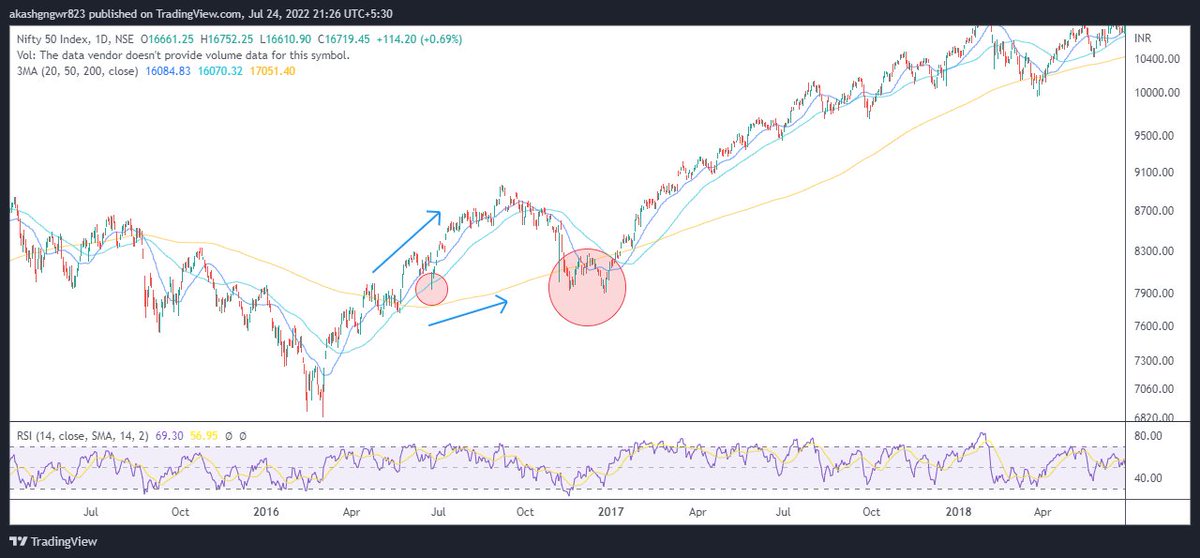
1. The moving average structure - Many traders just look at the 200 ma test or closing above/below it regardless of its slope. Let's look at all the interactions with 200 ma where price met it for the first time after the trend change but with 200 ma slope against it
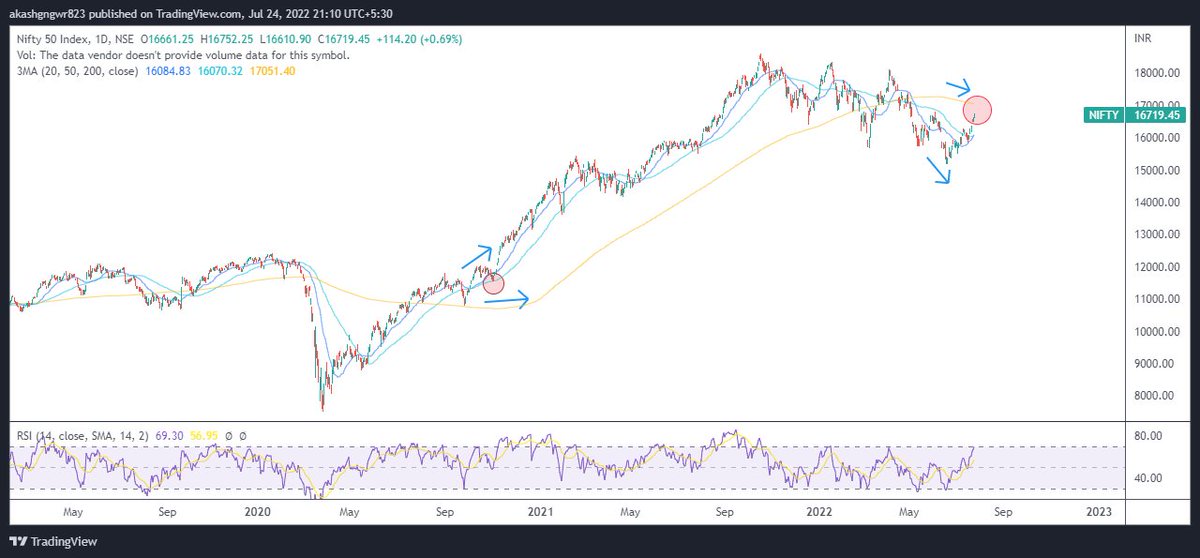
One can clearly sense that currently it is one of those scenarios only. I understand that I might get trolled for this, but an unbiased mind suggests that odds are highly against the bulls for making fresh investments.
But markets are good at giving surprises. What should be our stance if price kept on rising? Let's understand that through charts. The concept is still the same. Divergent 200 ma and price move results in 200 ma test atleast once which gives good investment opportunities.
2. Zig-Zag bear market- There are two types of fall in a bear market, the first one is vertical fall which usually ends with ending diagonals (falling wedges) and the second one is zig zag one which usually ends with parabolic down moves.
Do read it completely to understand the stance and the plan.
This thread will present a highly probable scenario of markets for the upcoming months. Will update the scenario too if there is a significant change in view in between.
— Aakash Gangwar (@akashgngwr823) May 15, 2022
1/n https://t.co/jfWOyEgZyd
1. The moving average structure - Many traders just look at the 200 ma test or closing above/below it regardless of its slope. Let's look at all the interactions with 200 ma where price met it for the first time after the trend change but with 200 ma slope against it
One can clearly sense that currently it is one of those scenarios only. I understand that I might get trolled for this, but an unbiased mind suggests that odds are highly against the bulls for making fresh investments.
But markets are good at giving surprises. What should be our stance if price kept on rising? Let's understand that through charts. The concept is still the same. Divergent 200 ma and price move results in 200 ma test atleast once which gives good investment opportunities.
2. Zig-Zag bear market- There are two types of fall in a bear market, the first one is vertical fall which usually ends with ending diagonals (falling wedges) and the second one is zig zag one which usually ends with parabolic down moves.