I got many requests to create a screener to shortlist the breakout stocks.
Well, here is one!
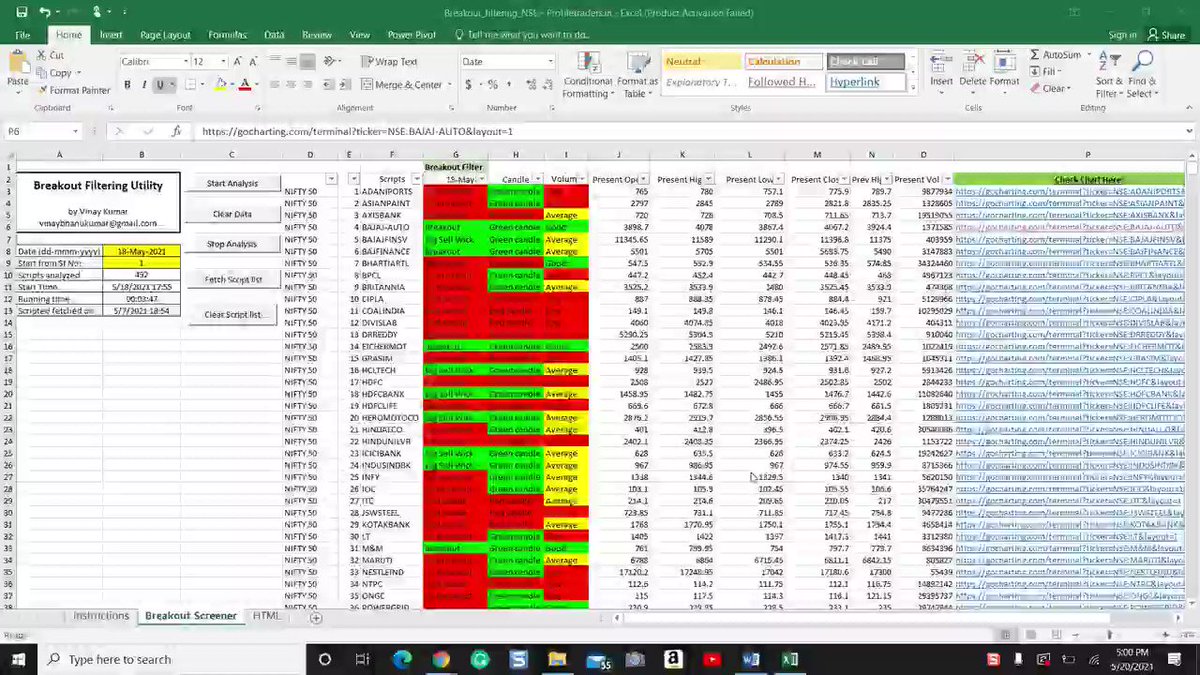
Finally, my friend created a "screener" to shortlist the breakout stocks.
It saves over 95% efforts & it is FREE!
Read the article to download it &
More from Indrazith Shantharaj

A Gap Open is a Big Headache for Intraday Traders.
Nowadays everyday market is opening with big gaps.
Solution?
Shifting to Stocks!
But How to Pick Good Stocks for Tomorrow's Trading?
Presenting 11 FREE Screeners to scan Stocks for the Next Trading Day!
Thread 🧵
(1/N)
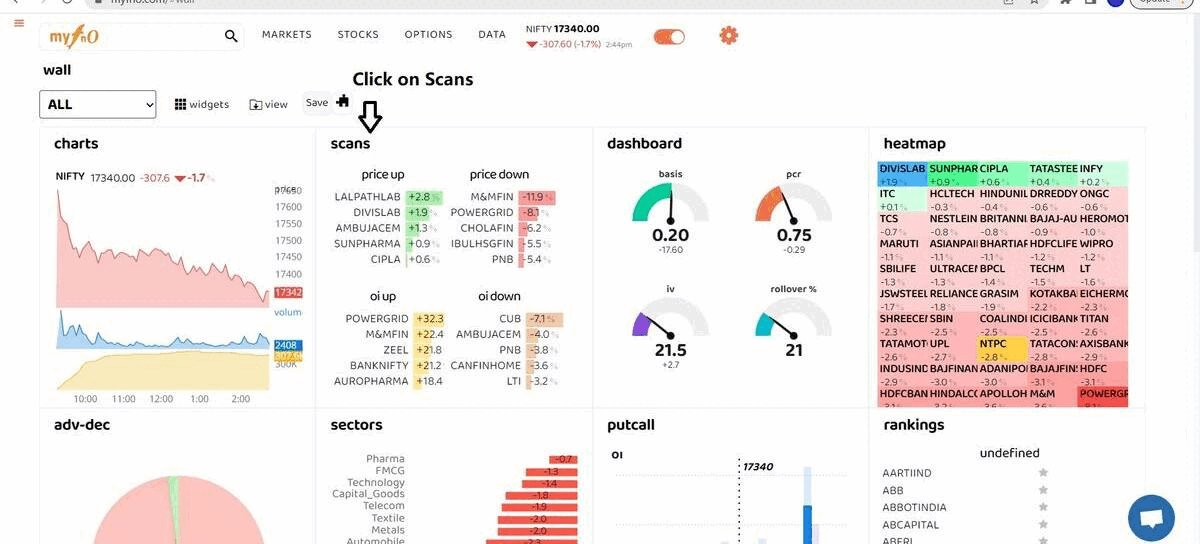
MYFNO - To Know the Stocks Which Received High and Low Open Interest (OI)
https://t.co/FURZDTArKK
(2/N)
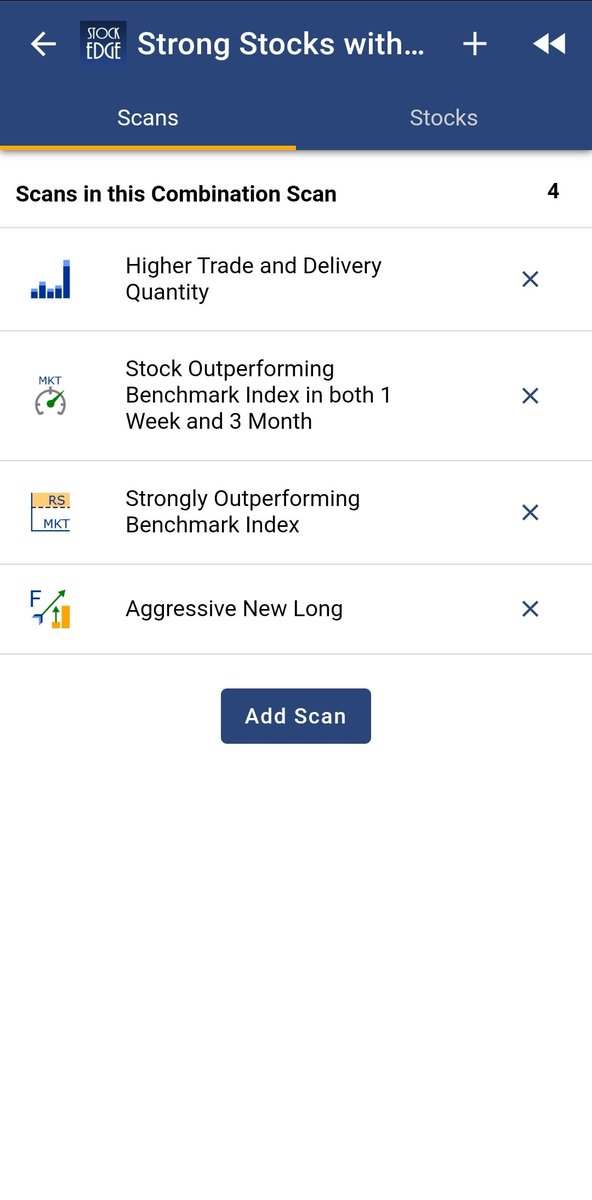
Shortlist Bullish Momentum Stocks
This Screener shortlists all the bullish momentum stocks from NSE for the next day's trading (based on price action).
https://t.co/3teN7JLDMs
(3/N)
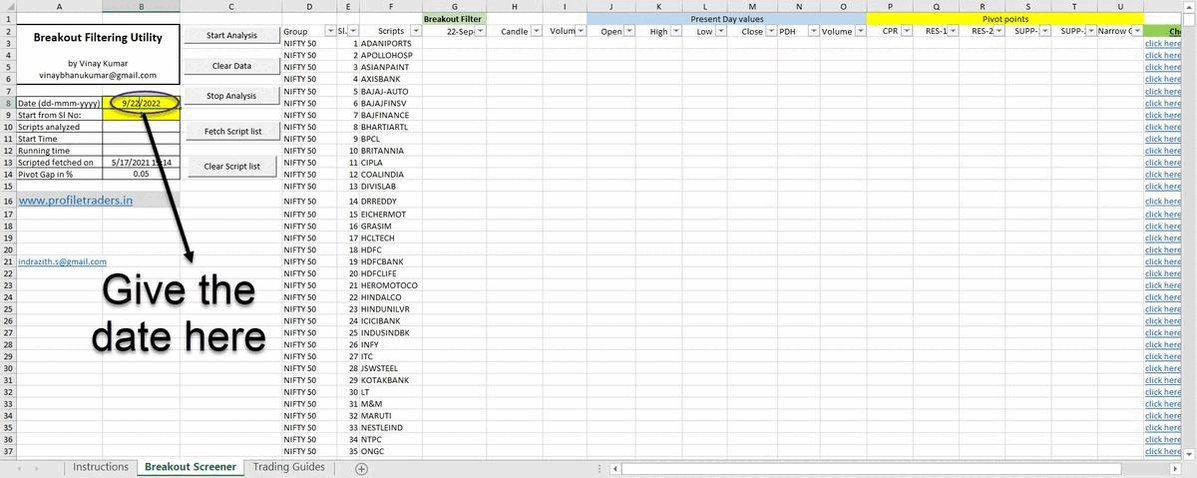
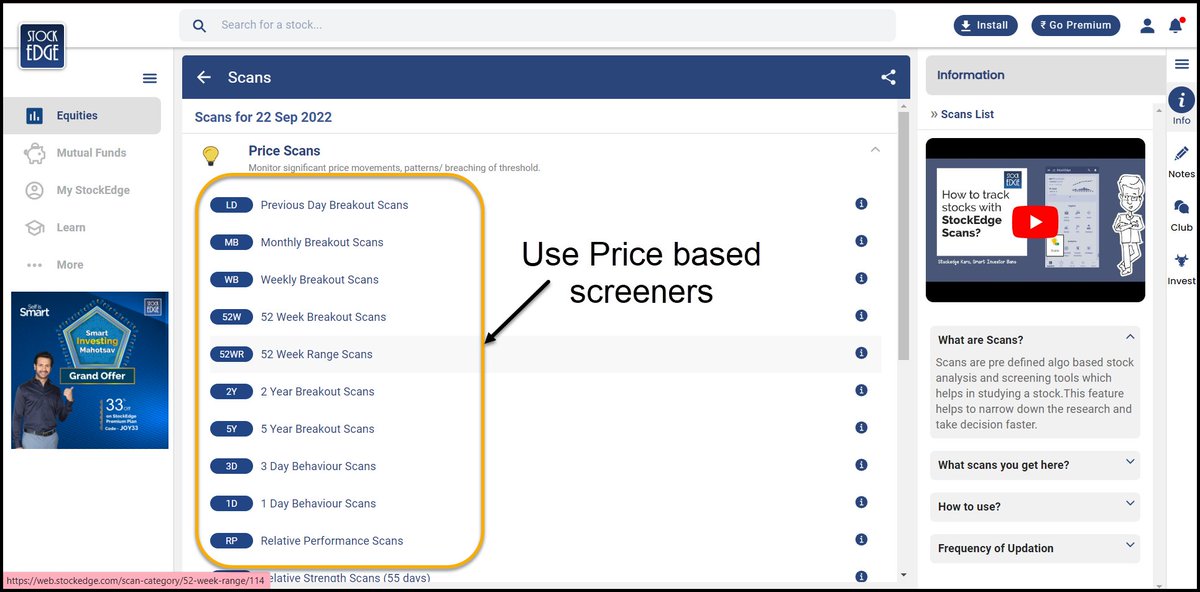
Screeners Based on Price (ex: Previous Day Breakout, Weekly Breakout, Monthly Breakout, etc.)
https://t.co/Y5naQIx967
(4/N)
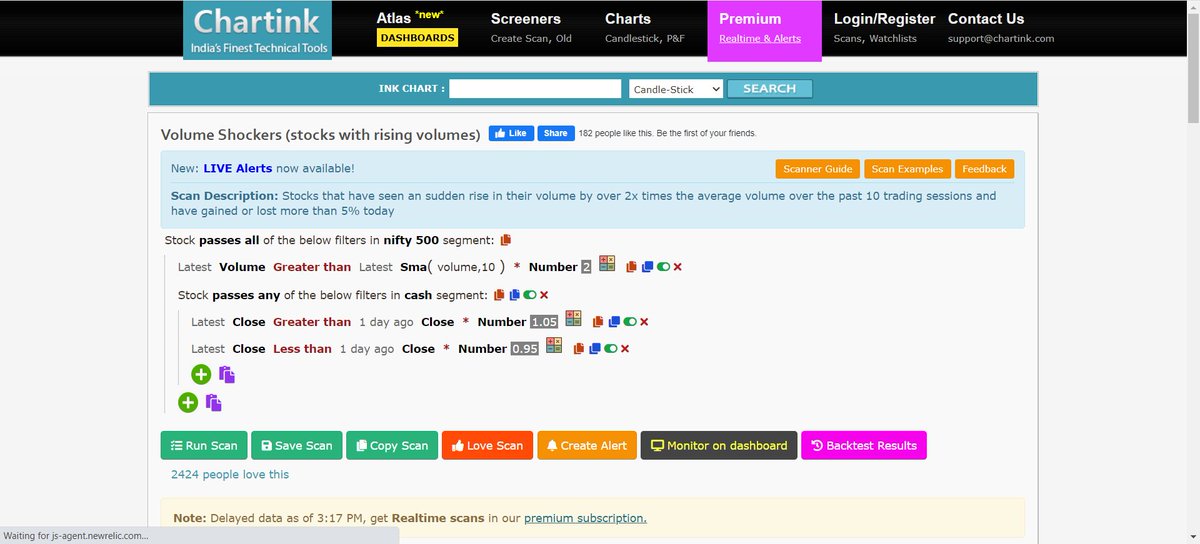
Volume Shockers - Stocks that received a huge volume
https://t.co/u9LTY5Yiir
(5/N)
Nowadays everyday market is opening with big gaps.
Solution?
Shifting to Stocks!
But How to Pick Good Stocks for Tomorrow's Trading?
Presenting 11 FREE Screeners to scan Stocks for the Next Trading Day!
Thread 🧵
(1/N)
MYFNO - To Know the Stocks Which Received High and Low Open Interest (OI)
https://t.co/FURZDTArKK
(2/N)
Shortlist Bullish Momentum Stocks
This Screener shortlists all the bullish momentum stocks from NSE for the next day's trading (based on price action).
https://t.co/3teN7JLDMs
(3/N)
Screeners Based on Price (ex: Previous Day Breakout, Weekly Breakout, Monthly Breakout, etc.)
https://t.co/Y5naQIx967
(4/N)
Volume Shockers - Stocks that received a huge volume
https://t.co/u9LTY5Yiir
(5/N)
More from Screeners

On the occasion of youtube 20k and Twitter 70k members
A small tribute/gift to members
Screeners
technical screeners - intraday and positional both
before proceeding - i have helped you , can i ask you so that it can help someone else too
thank you
positional one
run - find #stock - draw chart - find levels
1- Stocks closing daily 2% up from 5 days
https://t.co/gTZrYY3Nht
2- Weekly breakout
https://t.co/1f4ahEolYB
3- Breakouts in short term
https://t.co/BI4h0CdgO2
4- Bullish from last 5
intraday screeners
5- 15 minute Stock Breakouts
https://t.co/9eAo82iuNv
6- Intraday Buying seen in the past 15 minutes
https://t.co/XqAJKhLB5G
7- Stocks trading near day's high on 5 min chart with volume BO intraday
https://t.co/flHmm6QXmo
Thank you


You May Also Like

A list of cool websites you might now know about
A thread 🧵
1) Learn Anything - Search tools for knowledge discovery that helps you understand any topic through the most efficient
2) Grad Speeches - Discover the best commencement speeches.
This website is made by me
3) What does the Internet Think - Find out what the internet thinks about anything
4) https://t.co/vuhT6jVItx - Send notes that will self-destruct after being read.