#FreeTip
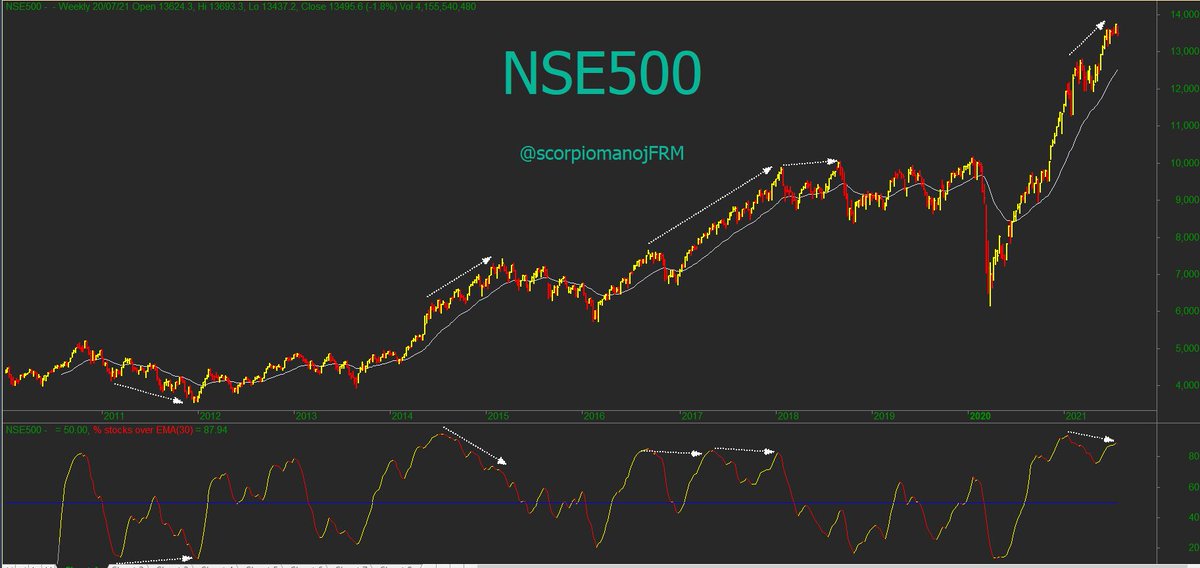
Some of the past market turns that were signaled by the % stocks above 30 week MA in weekly chart.
In daily there were even more and also the famous feb/mar2020 crash...
Have used N500 as it represents more stocks.
More from HMK alias MANOJ
#CHALET 239 . 11% up. Power of Stan Weinstein strategy.
#CHALET
— ScorpioManoj (@scorpiomanojFRM) September 26, 2021
217
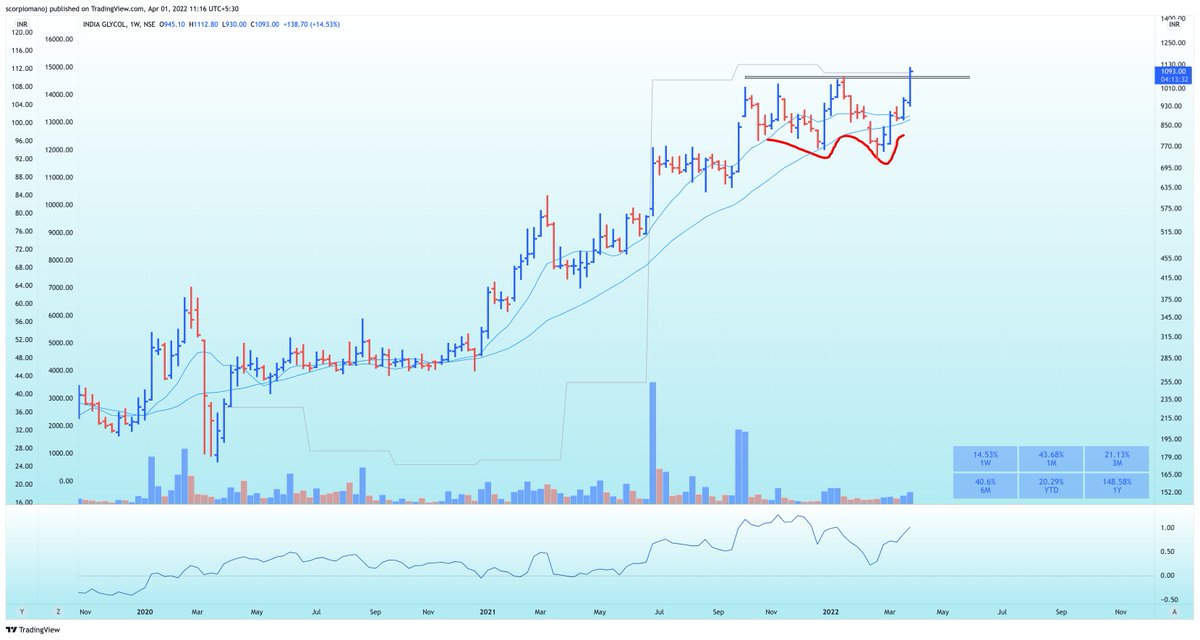
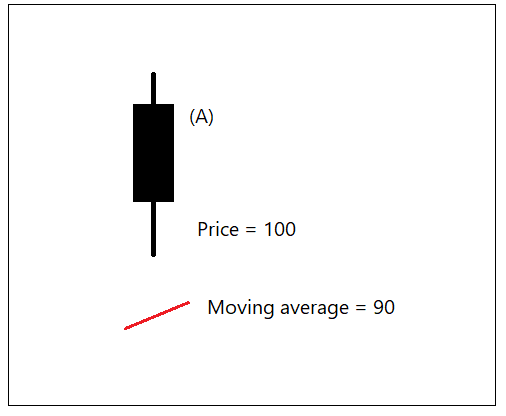
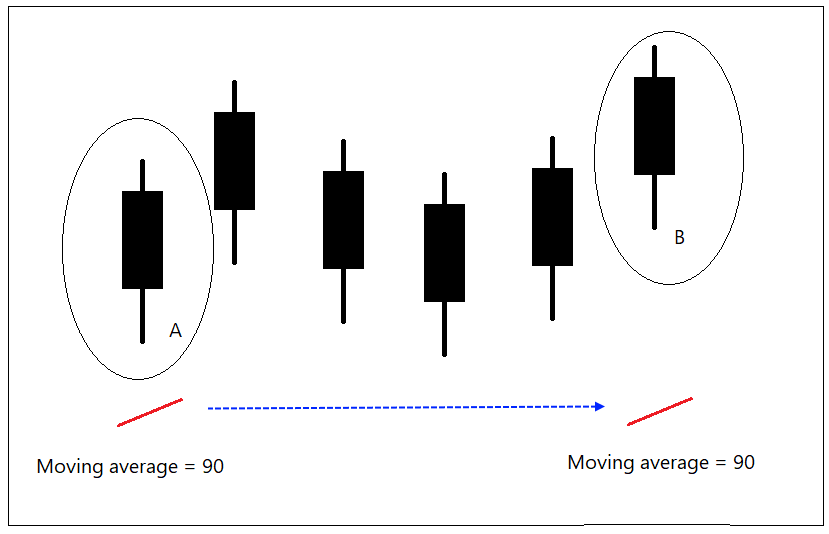
A Stan Weinstein strategy scan output.
Stock possibly trying to break to Stage 2 if moves above 220. Huge volume seen in previous week with a strong candle.
30wk MA started sloping upwards and RS sloping upwards.
Fundamentals not good. But huge instnl holdings. pic.twitter.com/PsjwoWbNFJ
More from Stockslearnings


Crisp and wonderfully explained. Urge EVERYONE to read this 🙏🏻
Friends,
— Pankaj DP (@voPAtrader) May 8, 2021
I am planning to write Stock mkt related thread (/writeup) on..
WHY STUFF WORK?
E.g. Why prior Support acts as Resistance?
If u have such questions related to Data/ TA, DM me. If possible, I shall incorporate reasoning for that as well.....#learning #stocks


You May Also Like

Keep dwelling on this:
Further Examination of the Motif near PRRA Reveals Close Structural Similarity to the SEB Superantigen as well as Sequence Similarities to Neurotoxins and a Viral SAg.
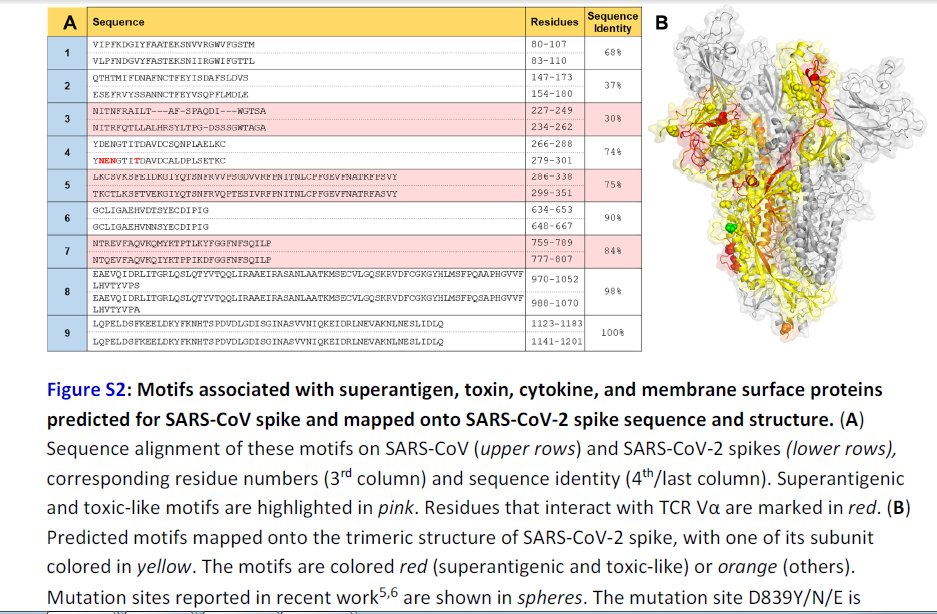
The insertion PRRA together with 7 sequentially preceding residues & succeeding R685 (conserved in β-CoVs) form a motif, Y674QTQTNSPRRAR685, homologous to those of neurotoxins from Ophiophagus (cobra) and Bungarus genera, as well as neurotoxin-like regions from three RABV strains
(20) (Fig. 2D). We further noticed that the same segment bears close similarity to the HIV-1 glycoprotein gp120 SAg motif F164 to V174.
https://t.co/EwwJOSa8RK
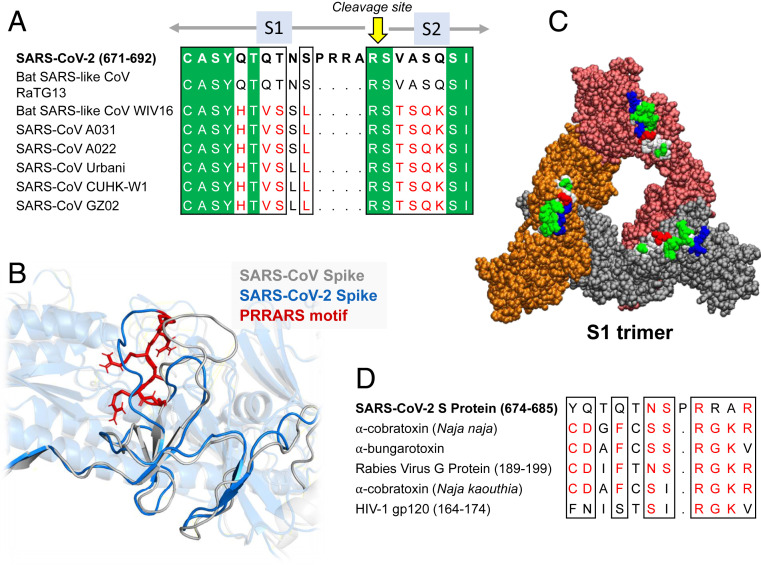
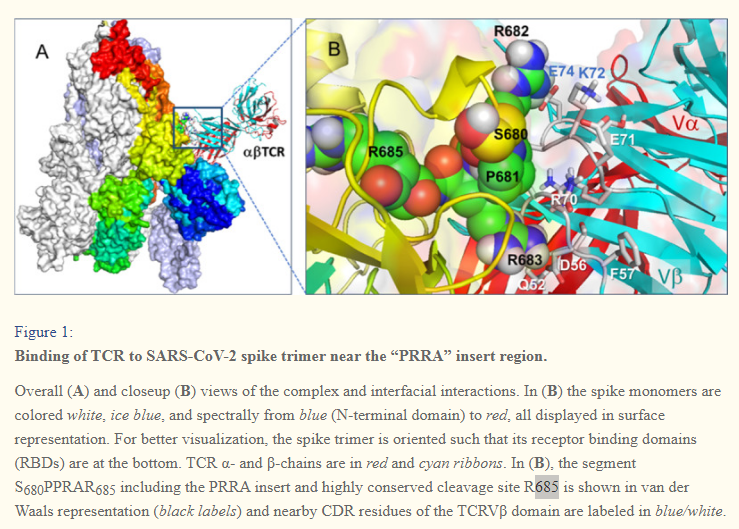
In (B), the segment S680PPRAR685 including the PRRA insert and highly conserved cleavage site *R685* is shown in van der Waals representation (black labels) and nearby CDR residues of the TCRVβ domain are labeled in blue/white
https://t.co/BsY8BAIzDa
Sequence Identity %
https://t.co/BsY8BAIzDa
Y674 - QTQTNSPRRA - R685
Similar to neurotoxins from Ophiophagus (cobra) & Bungarus genera & neurotoxin-like regions from three RABV strains
T678 - NSPRRA- R685
Superantigenic core, consistently aligned against bacterial or viral SAgs
Further Examination of the Motif near PRRA Reveals Close Structural Similarity to the SEB Superantigen as well as Sequence Similarities to Neurotoxins and a Viral SAg.
The insertion PRRA together with 7 sequentially preceding residues & succeeding R685 (conserved in β-CoVs) form a motif, Y674QTQTNSPRRAR685, homologous to those of neurotoxins from Ophiophagus (cobra) and Bungarus genera, as well as neurotoxin-like regions from three RABV strains
(20) (Fig. 2D). We further noticed that the same segment bears close similarity to the HIV-1 glycoprotein gp120 SAg motif F164 to V174.
https://t.co/EwwJOSa8RK
In (B), the segment S680PPRAR685 including the PRRA insert and highly conserved cleavage site *R685* is shown in van der Waals representation (black labels) and nearby CDR residues of the TCRVβ domain are labeled in blue/white
https://t.co/BsY8BAIzDa
Sequence Identity %
https://t.co/BsY8BAIzDa
Y674 - QTQTNSPRRA - R685
Similar to neurotoxins from Ophiophagus (cobra) & Bungarus genera & neurotoxin-like regions from three RABV strains
T678 - NSPRRA- R685
Superantigenic core, consistently aligned against bacterial or viral SAgs