
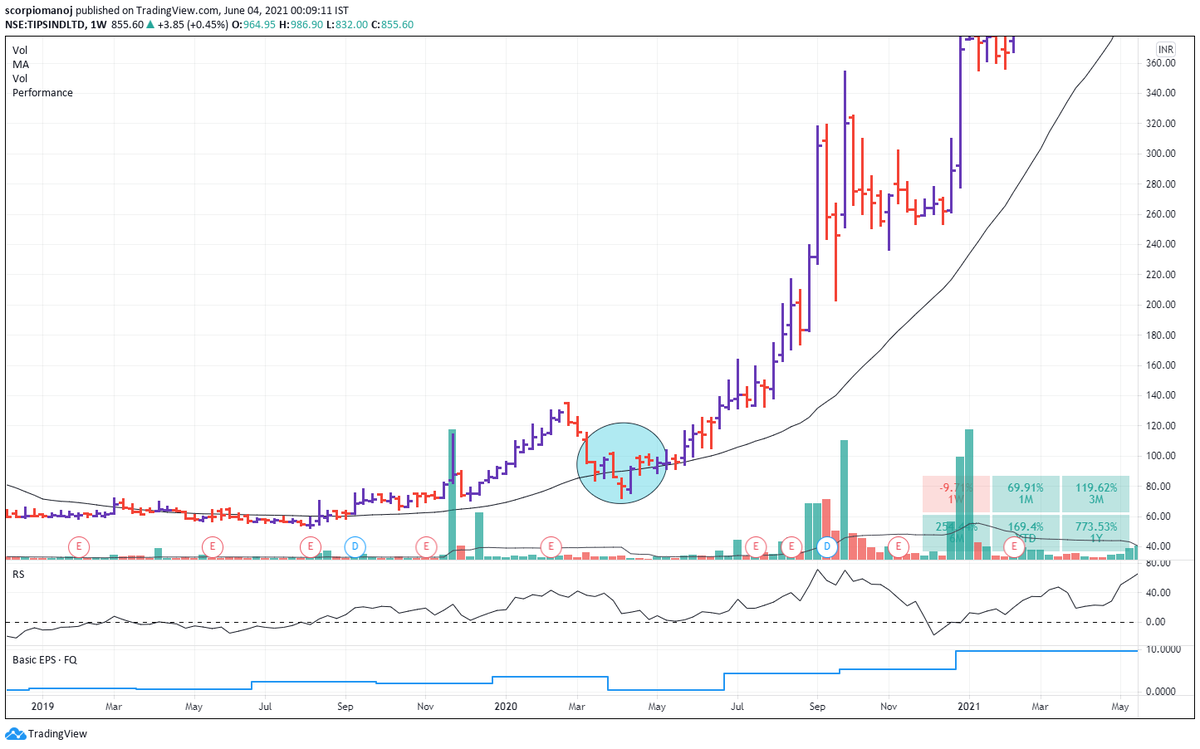
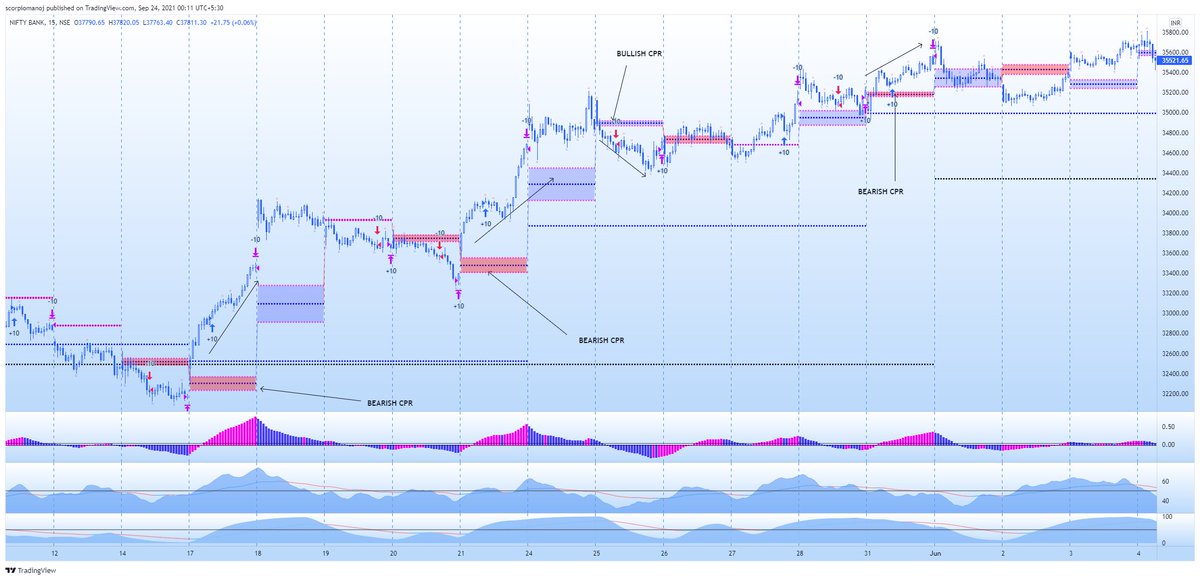
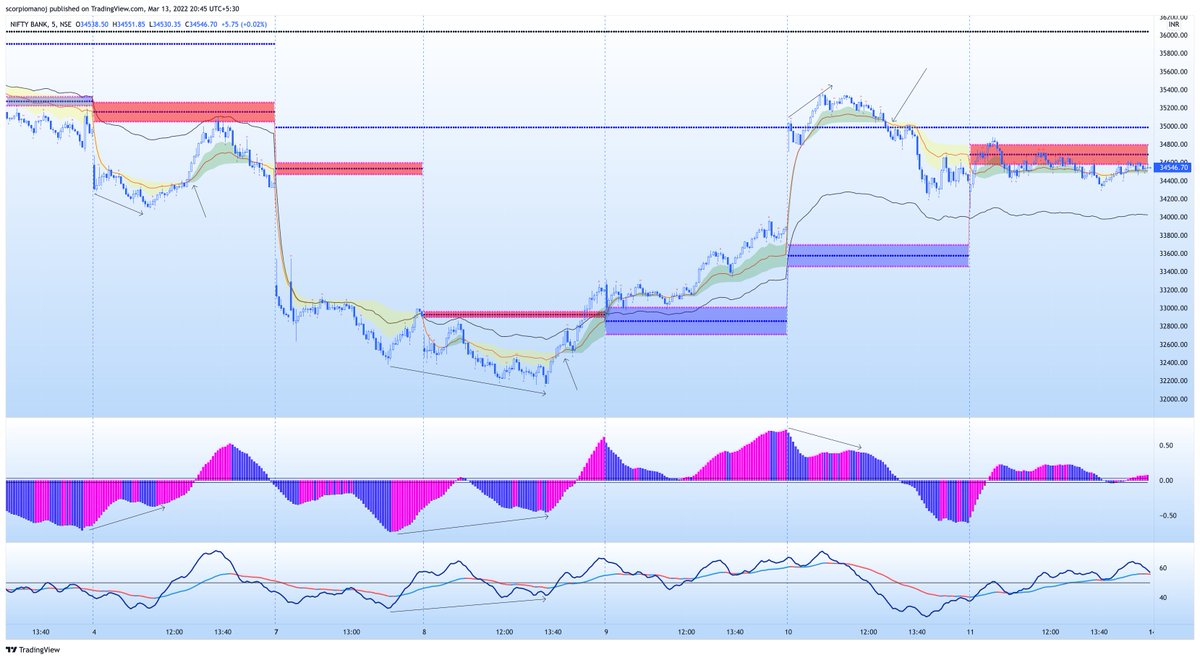
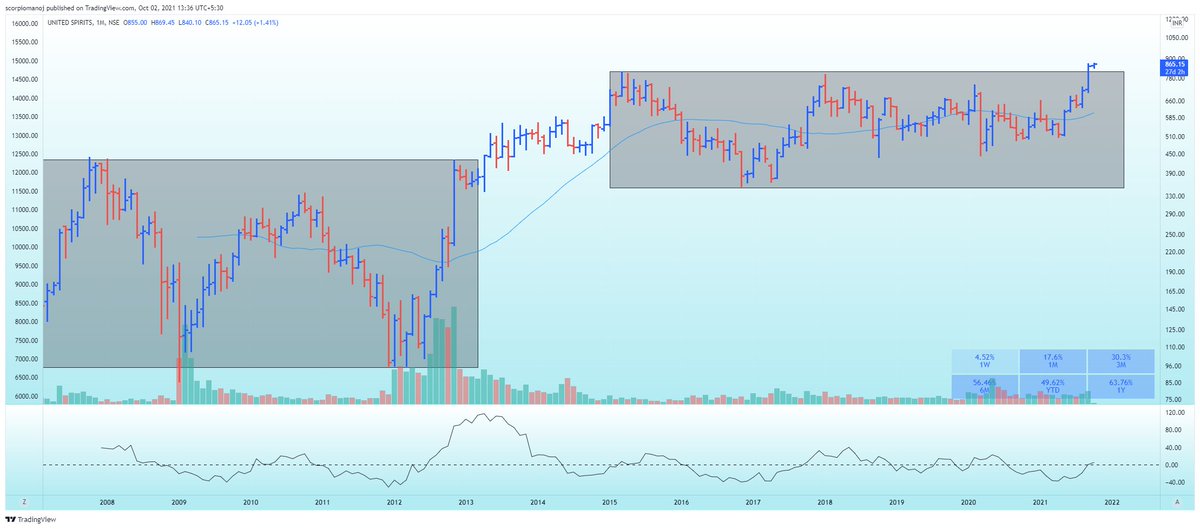
#FreeTip To understand y htf is important and to understand LTF is a function of htf, best way is to open an LTF chart (25/15/5 min) and zoom out ( minimize) the charts to have a birds eye view . Compare it with htf chart ( 75min / daily) . You can understand the significance.
More from ScorpioManoj
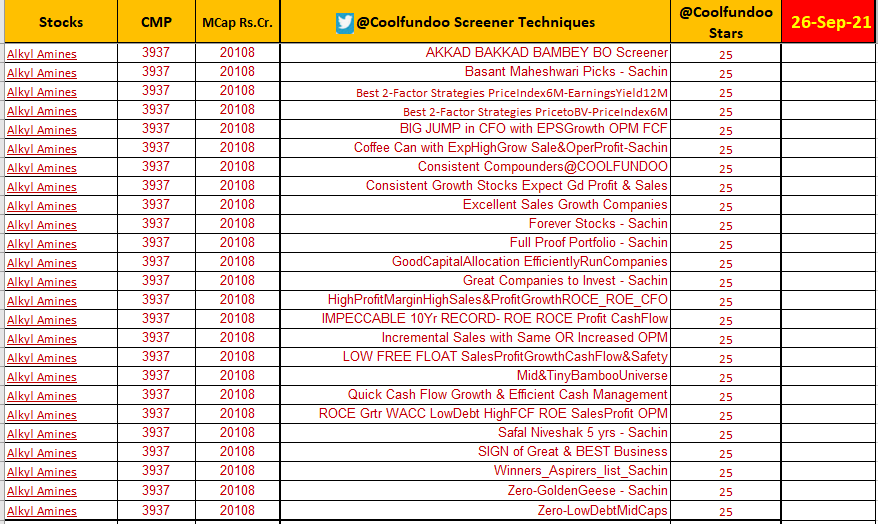
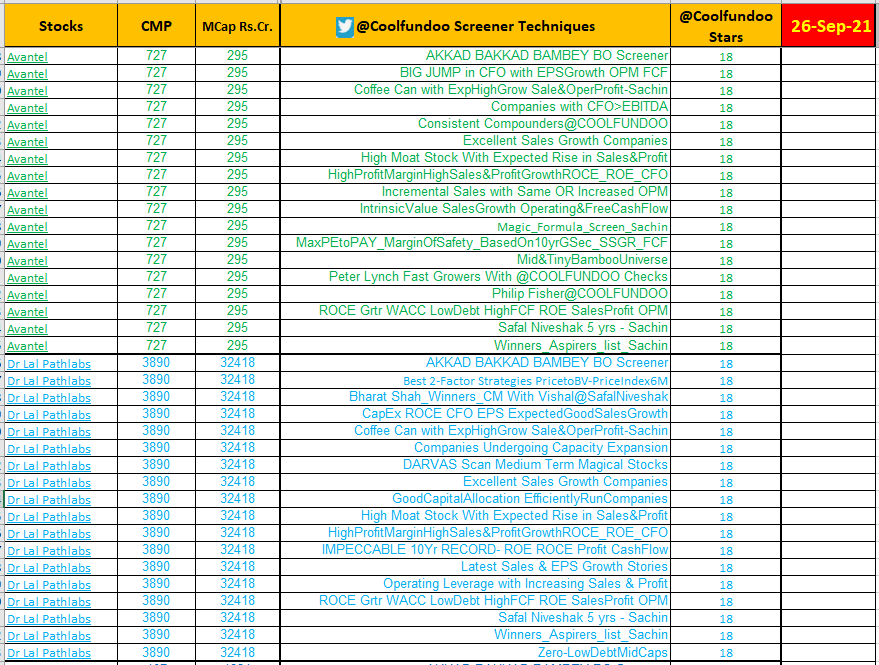
More from Screeners

Chartink Screeners Complete Compilation
Sharing 9 Screeners🧵
1. Swing Trading Techno Funda https://t.co/sV6e8XSFRK
2.Range Breakout
https://t.co/SNKEpGHNtv
3. Stocks in Tight Range :
https://t.co/MqDFMEfj82
Telegram Link : https://t.co/b4N4oPjqm9
Retweet and Share !
4.Stock Closing up 3% Since 3 days
https://t.co/vLGG9k3YKz
5. Close above 21 ema
https://t.co/fMZkgLczxR
6. Days Fall and Reversal
7. 52 WEEK high Stocks.
https://t.co/H6Z6IGMRwS
8. Intraday Stocks :https://t.co/JoXYRcogj7
9. Darvas Box


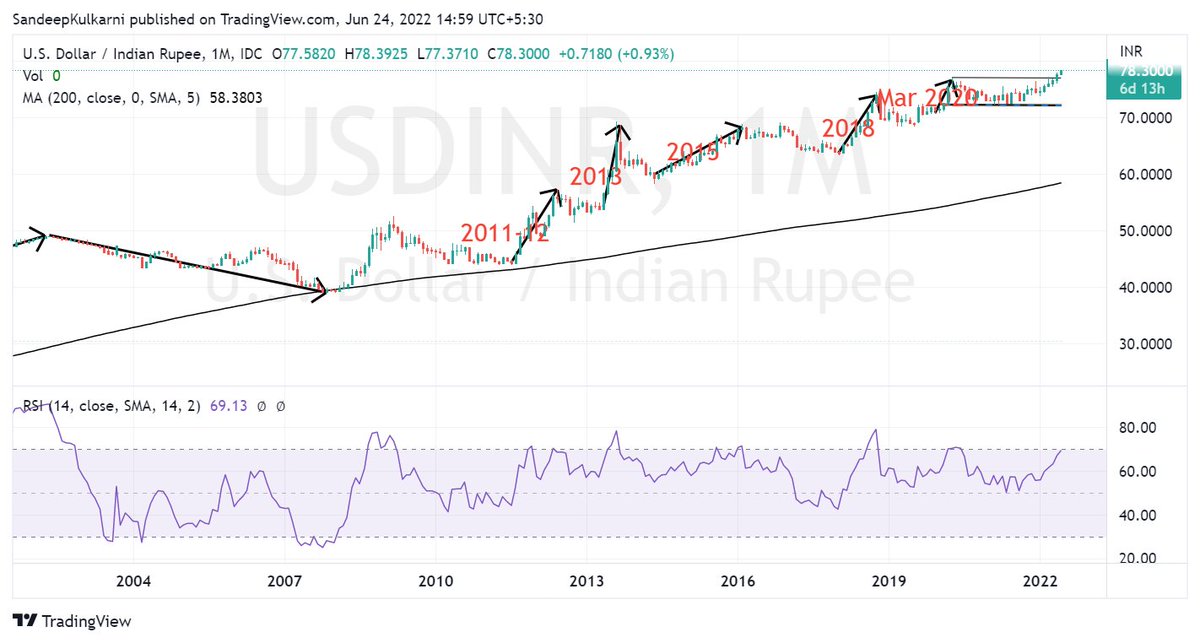
History tells us when #USDINR moves it moves a lot. In that context it has been remarkably resilient with just 8% depreciation. It looks like we are very close to the point from where Rupee will start to appreciating again.
BTW Nifty Metal has inverse correlation with USDINR. https://t.co/X6cqVcYF3V
BTW Nifty Metal has inverse correlation with USDINR. https://t.co/X6cqVcYF3V
We know how our stock market has weathered the FII selling.
— Sandeep Kulkarni (@moneyworks4u_fa) June 10, 2022
But the equally big story is how Rupee has weathered $50bn+ outflows since Oct 2021. Hats off to RBI Governor Das & his team for having the vision of building huge reserves in his tenure. pic.twitter.com/CVuF9dM361

Time for a new thread on the possibilities I am looking for.
Do read it completely to understand the stance and the plan.
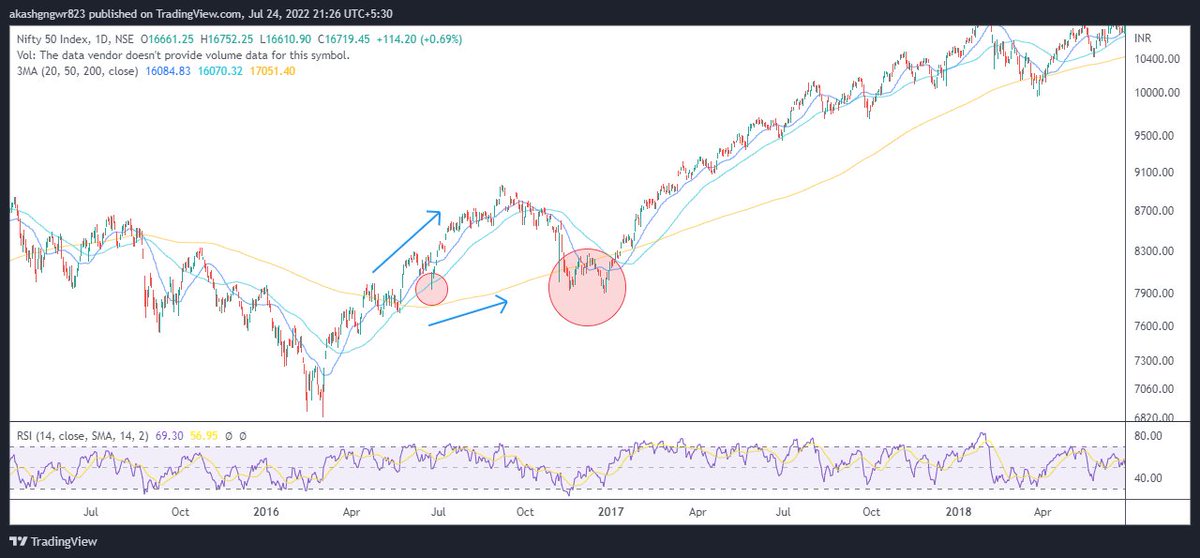
1. The moving average structure - Many traders just look at the 200 ma test or closing above/below it regardless of its slope. Let's look at all the interactions with 200 ma where price met it for the first time after the trend change but with 200 ma slope against it
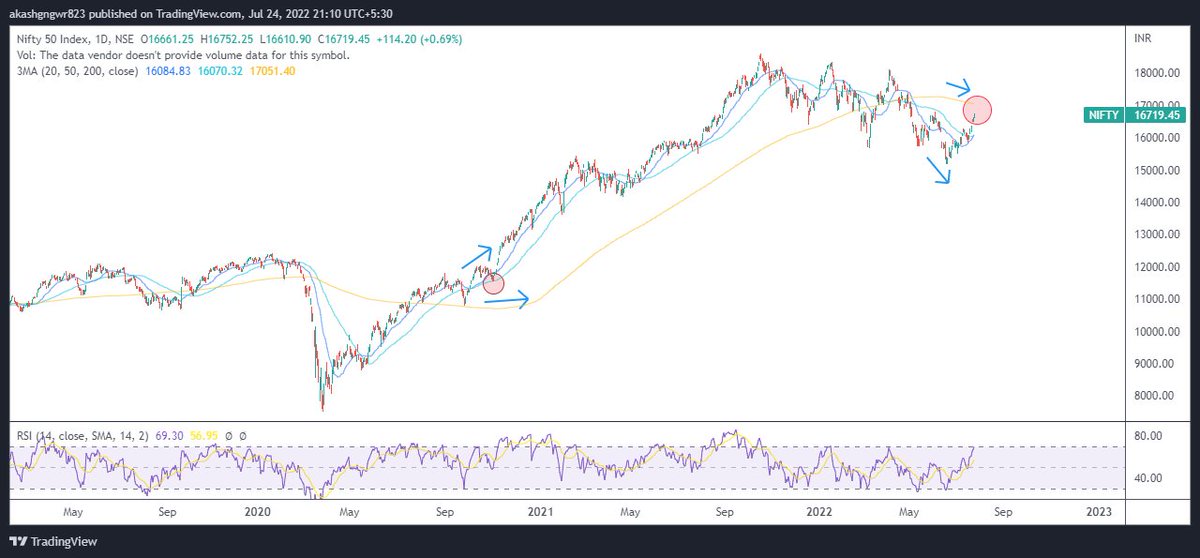
One can clearly sense that currently it is one of those scenarios only. I understand that I might get trolled for this, but an unbiased mind suggests that odds are highly against the bulls for making fresh investments.
But markets are good at giving surprises. What should be our stance if price kept on rising? Let's understand that through charts. The concept is still the same. Divergent 200 ma and price move results in 200 ma test atleast once which gives good investment opportunities.
2. Zig-Zag bear market- There are two types of fall in a bear market, the first one is vertical fall which usually ends with ending diagonals (falling wedges) and the second one is zig zag one which usually ends with parabolic down moves.
Do read it completely to understand the stance and the plan.
This thread will present a highly probable scenario of markets for the upcoming months. Will update the scenario too if there is a significant change in view in between.
— Aakash Gangwar (@akashgngwr823) May 15, 2022
1/n https://t.co/jfWOyEgZyd
1. The moving average structure - Many traders just look at the 200 ma test or closing above/below it regardless of its slope. Let's look at all the interactions with 200 ma where price met it for the first time after the trend change but with 200 ma slope against it
One can clearly sense that currently it is one of those scenarios only. I understand that I might get trolled for this, but an unbiased mind suggests that odds are highly against the bulls for making fresh investments.
But markets are good at giving surprises. What should be our stance if price kept on rising? Let's understand that through charts. The concept is still the same. Divergent 200 ma and price move results in 200 ma test atleast once which gives good investment opportunities.
2. Zig-Zag bear market- There are two types of fall in a bear market, the first one is vertical fall which usually ends with ending diagonals (falling wedges) and the second one is zig zag one which usually ends with parabolic down moves.
You May Also Like


So it's now October 10, 2018 and....Rod Rosenstein is STILL not fired.
He's STILL in charge of the Mueller investigation.
He's STILL refusing to hand over the McCabe memos.
He's STILL holding up the declassification of the #SpyGate documents & their release to the public.
I love a good cover story.......
The guy had a face-to-face with El Grande Trumpo himself on Air Force One just 2 days ago. Inside just about the most secure SCIF in the world.
And Trump came out of AF1 and gave ol' Rod a big thumbs up!
And so we're right back to 'that dirty rat Rosenstein!' 2 days later.
At this point it's clear some members of Congress are either in on this and helping the cover story or they haven't got a clue and are out in the cold.
Note the conflicting stories about 'Rosenstein cancelled meeting with Congress on Oct 11!"
First, rumors surfaced of a scheduled meeting on Oct. 11 between Rosenstein & members of Congress, and Rosenstein just cancelled it.
Rep. Andy Biggs and Rep. Matt Gaetz say DAG Rod Rosenstein cancelled an Oct. 11 appearance before the judiciary and oversight committees. They are now calling for a subpoena. pic.twitter.com/TknVHKjXtd
— Ivan Pentchoukov \U0001f1fa\U0001f1f8 (@IvanPentchoukov) October 10, 2018

MDZS is laden with buddhist references. As a South Asian person, and history buff, it is so interesting to see how Buddhism, which originated from India, migrated, flourished & changed in the context of China. Here's some research (🙏🏼 @starkjeon for CN insight + citations)
1. LWJ’s sword Bichen ‘is likely an abbreviation for the term 躲避红尘 (duǒ bì hóng chén), which can be translated as such: 躲避: shunning or hiding away from 红尘 (worldly affairs; which is a buddhist teaching.) (https://t.co/zF65W3roJe) (abbrev. TWX)
2. Sandu (三 毒), Jiang Cheng’s sword, refers to the three poisons (triviṣa) in Buddhism; desire (kāma-taṇhā), delusion (bhava-taṇhā) and hatred (vibhava-taṇhā).
These 3 poisons represent the roots of craving (tanha) and are the cause of Dukkha (suffering, pain) and thus result in rebirth.
Interesting that MXTX used this name for one of the characters who suffers, arguably, the worst of these three emotions.
3. The Qian kun purse “乾坤袋 (qián kūn dài) – can be called “Heaven and Earth” Pouch. In Buddhism, Maitreya (मैत्रेय) owns this to store items. It was believed that there was a mythical space inside the bag that could absorb the world.” (TWX)

