Understanding Buyers vs Sellers using
candlesticks PART-1

Mini Thread ๐Ÿงต #trading #StockMarketindia

Traders show your support by Retweet to benefit maximum traders

@Mitesh_Engr @ITRADE191 @hjyadav @nakulvibhor @RajarshitaS @chartmojo @ca_mehtaravi

Here i am just trying to focus on few candlestick formation and trying to understand buyers vs sellers at reference levels. In trading less is more

Type 1 - Buyers aggression
Type 2 - Sellers aggression
Type 3 - Full confusion

Follow stay away approach when you are confused
Chart 1. Looking at candlesticks formation at reference levels is way more better than looking candlesticks everywhere or every second
Chart 2
Chart 3. Make your trading style as simple as possible

A small thread of Part 1 will share more examples in upcoming days and will try to post some live examples during market hours.

More from Learn to Trade

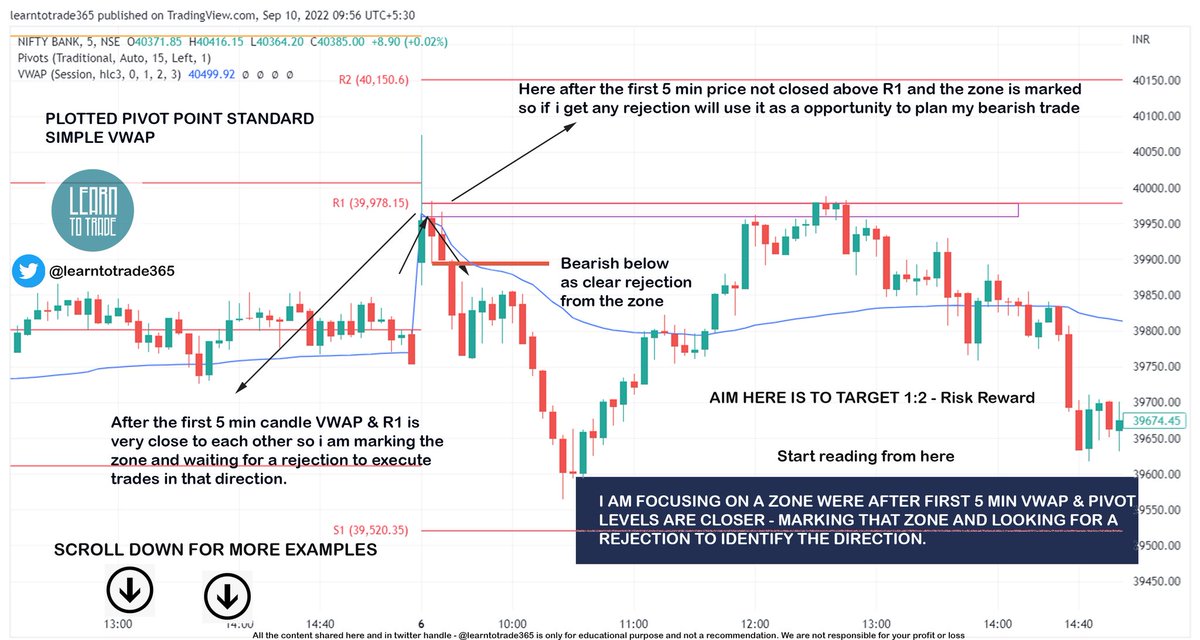
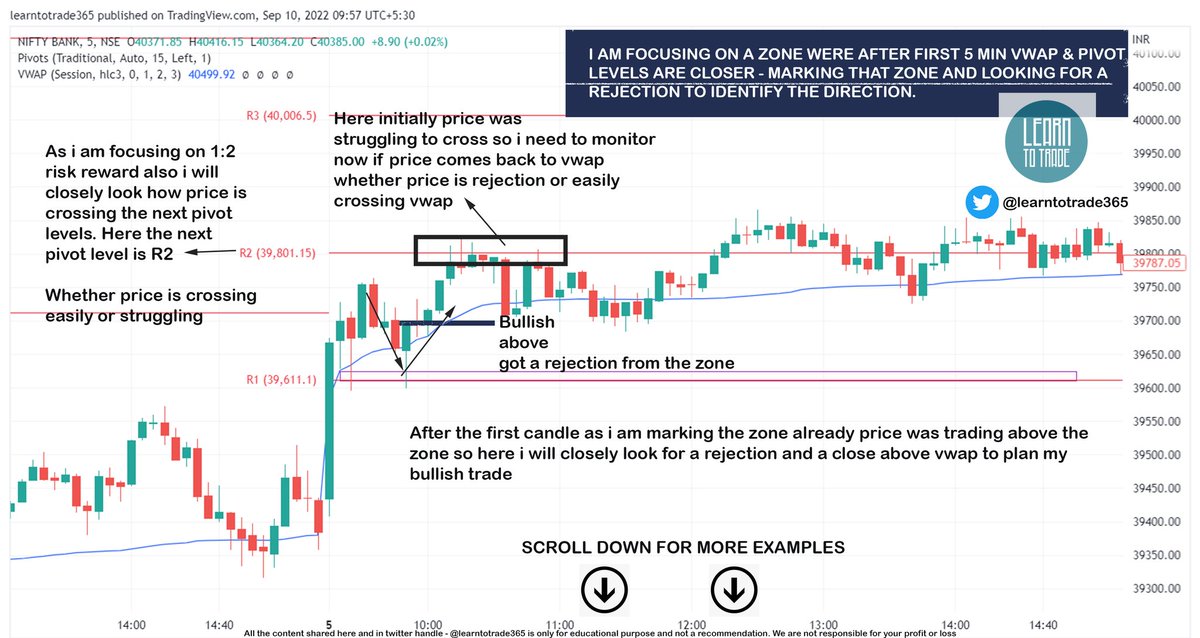
Vwap & Pivot Points - Trading Zones for intraday directional traders

Intraday Trading strategy for Trend followers ๐Ÿงต

Support us by RETWEET this tweet to reach and benefit most traders so it can help them to gain knowledge

Scroll down ๐Ÿ‘‡


I also do All Trading day Live Market session during Market hours from morning 9:00 a.m to 01:00 p.m - Follow me @learntotrade365

Join the Telegram channel for Live Market updates and live session immediate notification

https://t.co/VU0bCGjU7s

Scroll down for chart examples ๐Ÿ‘‡

Make your Trading system very simple so your main aim is to focus on the price not on various indicators.

Scroll down for more examples ๐Ÿ‘‡


Rather than chasing the price looking at candle colours start trading in a perspective of risk to reward based approach

Scroll down for more examples ๐Ÿ‘‡


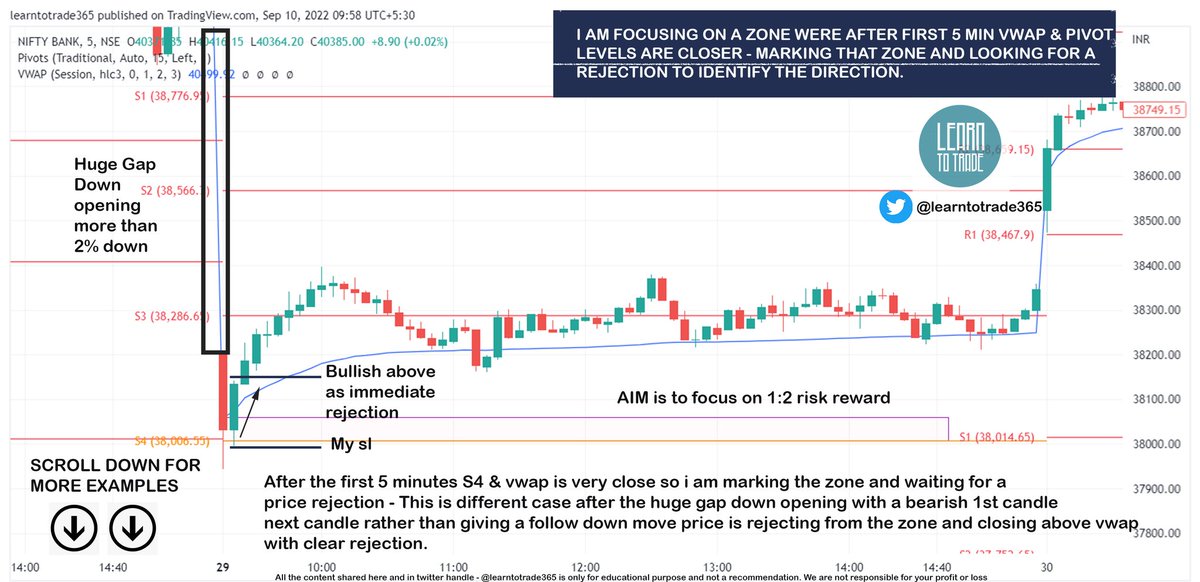
Try to understand what retail traders will do. Even in this below example after looking at more than 2% gap down many traders will not much think to plan a bullish trade but chart is showing Sellers are not making a Follow through downmove

Scroll down for more examples ๐Ÿ‘‡

More from Stocklearnings

You May Also Like

The YouTube algorithm that I helped build in 2011 still recommends the flat earth theory by the *hundreds of millions*. This investigation by @RawStory shows some of the real-life consequences of this badly designed AI.


This spring at SxSW, @SusanWojcicki promised "Wikipedia snippets" on debated videos. But they didn't put them on flat earth videos, and instead @YouTube is promoting merchandising such as "NASA lies - Never Trust a Snake". 2/


A few example of flat earth videos that were promoted by YouTube #today:
https://t.co/TumQiX2tlj 3/

https://t.co/uAORIJ5BYX 4/

https://t.co/yOGZ0pLfHG 5/
Nano Course On Python For Trading
==========================
Module 1

Python makes it very easy to analyze and visualize time series data when youโ€™re a beginner. It's easier when you don't have to install python on your PC (that's why it's a nano course, you'll learn python...

... on the go). You will not be required to install python in your PC but you will be using an amazing python editor, Google Colab Visit
https://t.co/EZt0agsdlV

This course is for anyone out there who is confused, frustrated, and just wants this python/finance thing to work!

In Module 1 of this Nano course, we will learn about :

# Using Google Colab
# Importing libraries
# Making a Random Time Series of Black Field Research Stock (fictional)

# Using Google Colab

Intro link is here on YT: https://t.co/MqMSDBaQri

Create a new Notebook at https://t.co/EZt0agsdlV and name it AnythingOfYourChoice.ipynb

You got your notebook ready and now the game is on!
You can add code in these cells and add as many cells as you want

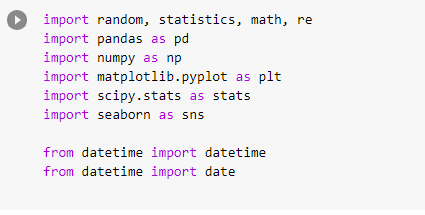
# Importing Libraries

Imports are pretty standard, with a few exceptions.
For the most part, you can import your libraries by running the import.
Type this in the first cell you see. You need not worry about what each of these does, we will understand it later.