2/15
A simple thread to understand relationship between US Dollar and Emerging Markets.
The relationship between the performance of Emerging Market stocks and the US Dollar is one of the tightest macro relationships that exists in investing.
1/15
2/15
When US Dollar weakens, EM index outperform World Index and when US Dollar strengthens EM index underperform World index.
3/15
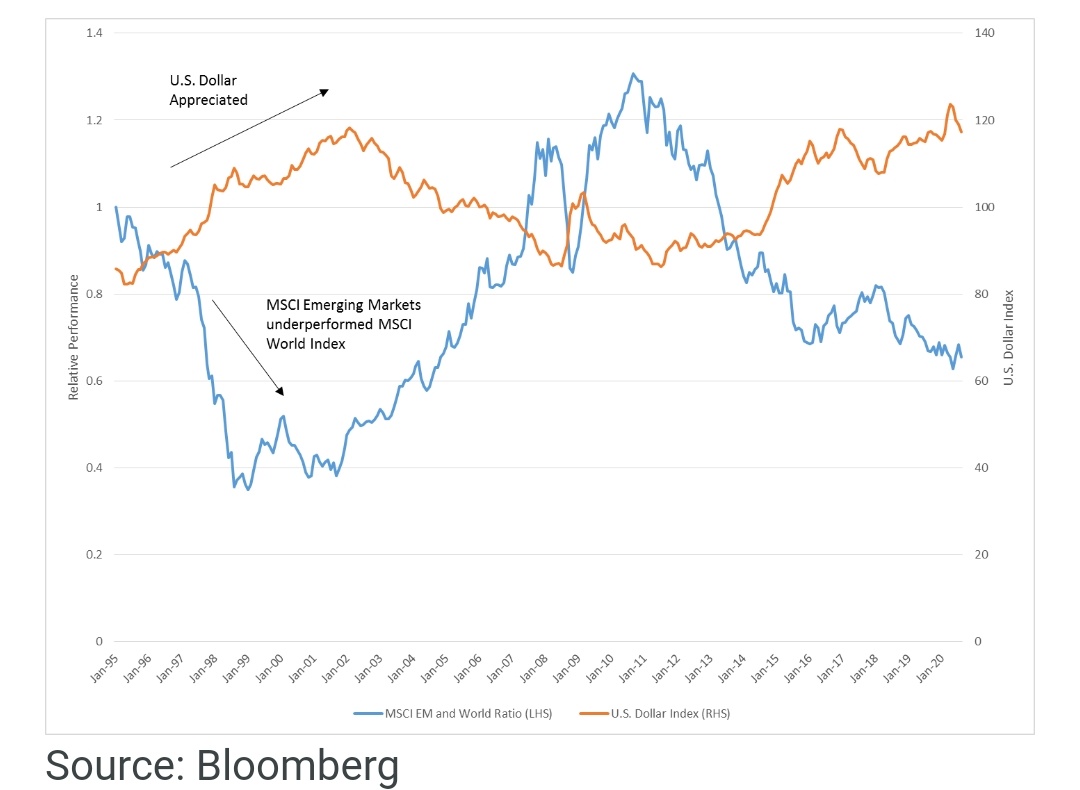
Then from 2001 to 2010, the U.S. dollar depreciated over 18% while the MSCI EM Index outperformed the MSCI World Index by 14% annualised.
4/15
Overall, from 1995 to 2020, this relationship has a correlation of -0.35.
5/15
A weaker dollar allows Emerging Market countries more freedom to provide fiscal stimulus without fearing negative implications for their own economies.
6/15
As case with India, government will be more comfortable to push fiscal stimulus now when INR is stable.
7/15
Emerging markets are a natural choice as they tend to benefit from weakening dollar and grow faster than DMs.
8/15
9/15
10/15
Easy monetary policy weakens the dollar and leads to its depreciation. Since U.S. dollar is a fiat currency, meaning that it is not backed by gold, it can be created anytime easily.
11/15
12/15
13/15
14/15
Since US Fed has expanded its Balance Sheet at record speed, US Dollar may go through a weak patch.
Taking cue from multiple cycles in the past, if US Dollar continues to weaken, Emerging Market stocks may outperform.
Watch this trend closely!
15/15 End
Edelweiss Emerging Market Opportunities Equity Offshore Fund
https://t.co/ea0nbUxAmF
Edelweiss Greater China Equity Offshore Fund
https://t.co/AXEWzfKdhY
More from Finance
Thread: P&F Super Pattern
An effective price pattern defined using properties of P&F charts.
#Superpattern #Pointandfigure #Definedge
Point & Figure is an oldest charting method where price is plotted vertically, and the chart moves only when price moves. It is a different way of looking at the price, the objective box-value and reversal value offers advantage of identifying objective price patterns.
When price is moving up, it is plotted in a column of 'X'. When it is going down, it is plotted in a column of ‘O’. Normally, three-box reversal criteria is used to define the trend & reversal. Unlike a bar or candle, the P&F column can have multiple sessions in it.
Link to know more about the subject:
https://t.co/2xtLAVPBvm
See below chart. Price is in a strong uptrend, P&F chart would produce a long of column of 'X' with more number of boxes in it.
If such a trend is followed by some time bars without meaningful price correct, P&F chart would not move, and it will remain in column of 'X' in such a scenario.
An effective price pattern defined using properties of P&F charts.
#Superpattern #Pointandfigure #Definedge
Point & Figure is an oldest charting method where price is plotted vertically, and the chart moves only when price moves. It is a different way of looking at the price, the objective box-value and reversal value offers advantage of identifying objective price patterns.
When price is moving up, it is plotted in a column of 'X'. When it is going down, it is plotted in a column of ‘O’. Normally, three-box reversal criteria is used to define the trend & reversal. Unlike a bar or candle, the P&F column can have multiple sessions in it.
Link to know more about the subject:
https://t.co/2xtLAVPBvm
See below chart. Price is in a strong uptrend, P&F chart would produce a long of column of 'X' with more number of boxes in it.
If such a trend is followed by some time bars without meaningful price correct, P&F chart would not move, and it will remain in column of 'X' in such a scenario.
I'm lucky to attain financial freedom before 30.
I credit Fintwit for my learnings.
Here's 10 key concepts every investor must know:
1. $$ needed to retire
2. Researching a business
3. Reading annual reports
4. Reading earnings calls
5. Criteria of a multi bagger
(Read on...)
6. Holding a multi bagger
7. Economic moats
8. When to buy a stock
9. Earnings vs cashflow
10. Traits of quality companies
Here's my 10 favourite threads on these concepts:
1. How much $$ do you need to retire
Before you start, you must know the end game.
To meet your retirement goals...
How much $$ do you need in your portfolio?
10-K Diver does a good job explaining what's a safe withdrawl rate.
Hint: It's NOT
2. Research a business
Your investment returns are a lagging indicator.
Instead, your research skills are the leading predictor of your results.
Conclusion?
To be a good investor, you must be a great business researcher.
Start with
3. Reading annual reports
This is the bread and butter of a good business analyst.
You cannot just listen to opinions from others.
You must learn to deep dive a business and make your own judgments.
Start with the 10k.
Ming Zhao explains it
I credit Fintwit for my learnings.
Here's 10 key concepts every investor must know:
1. $$ needed to retire
2. Researching a business
3. Reading annual reports
4. Reading earnings calls
5. Criteria of a multi bagger
(Read on...)
6. Holding a multi bagger
7. Economic moats
8. When to buy a stock
9. Earnings vs cashflow
10. Traits of quality companies
Here's my 10 favourite threads on these concepts:
1. How much $$ do you need to retire
Before you start, you must know the end game.
To meet your retirement goals...
How much $$ do you need in your portfolio?
10-K Diver does a good job explaining what's a safe withdrawl rate.
Hint: It's NOT
1/
— 10-K Diver (@10kdiver) July 25, 2020
Get a cup of coffee.
In this thread, I'll help you work out how much money you need to retire.
2. Research a business
Your investment returns are a lagging indicator.
Instead, your research skills are the leading predictor of your results.
Conclusion?
To be a good investor, you must be a great business researcher.
Start with
1/ Thoughts on Research Process
— Mostly Borrowed Ideas (@borrowed_ideas) September 27, 2021
I was invited to present my research process at a college in the US. I am sharing all ten slides here. pic.twitter.com/z0tjZcogfH
3. Reading annual reports
This is the bread and butter of a good business analyst.
You cannot just listen to opinions from others.
You must learn to deep dive a business and make your own judgments.
Start with the 10k.
Ming Zhao explains it
\U0001f9d0How to Read 10Ks Like a Hedge Fund\U0001f9d0
— Ming Zhao (@FabiusMercurius) May 7, 2021
\u201cFundamentals don\u2019t matter anymore!\u201d I\u2019ve heard this a lot lately on Fintwit.\U0001f644
But, for those who\u2019ve diversify beyond $GME and $DOGE, here\u2019s a primer on what metrics fundamental buy-side PMs look at and why:
(real examples outlined)
\U0001f447 pic.twitter.com/tLlNRvpnDK