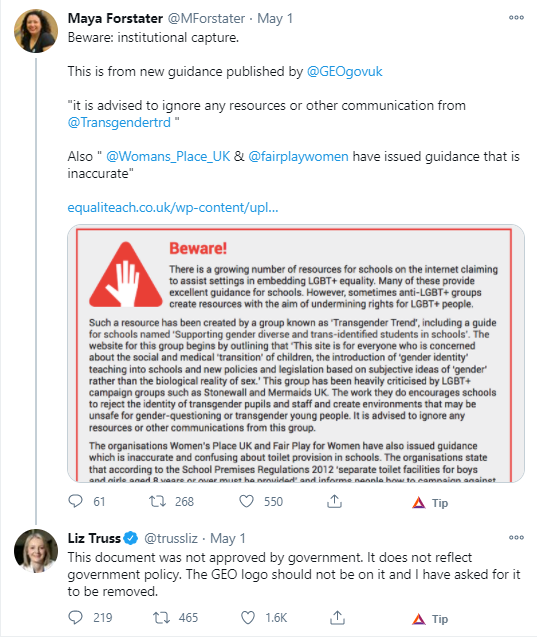
A thread on how absurd the UK is on transgender issues and how the UK got so transphobic
In 2015 Parliament held an inquiry looking into the state of Transgender equality. Trans people of all stripes outlined many different problems across many, many different areas.
They had no evidence to back this up. Not a single country, state of province that has self ID...
This was a chain of powerful cisgender people using the trans community for their own gain. All it did was cost us.
She said she wanted to protect children from an ongoing crisis...
site:https://t.co/eQN31ghiwL sinclairslaw
And remember, Susan Evans claims she is a feminist and LGBT ally. Why would she choose this man over the thousands other UK solicitors?
It meant protecting single sex spaces from trans people
In other words, she believed that allowing trans people to change their birth certificates could be dangerous. Apparently she believes birth certificates stop sexual assaults?
In other words, she wanted to make it even harder than it already was for young trans people to access gender identity healthcare.
This was a bathroom bill for the UK.
They wanted trans people to have the right to change their birth certificates without permission.
That was it.
https://t.co/lrHlpYRBKp
This was not mentioned in the judicial review.
She did so by arguing that focusing on these issues was a "failure of the left". And then she said this:

And she compared trans people using a public toilet to pedophile gangs whilst doing so.
1 in 3 UK employers will not employ a trans person because they are trans:
Almost half of trans people have a suicide attempt in their past :https://t.co/d4w3A7RTwa
And it is all thanks to the UK media, the UK government and a small group of anti trans radicals.
And if you are trans..
If there aren't any near you, start one.
If you run a group, connect with other group runners near you.
Build a network.
We are so far away from being safe, you have no choice but to connect, organise and step up.
More from Society

global health policy in 2020 has centered around NPI's (non-pharmaceutical interventions) like distancing, masks, school closures
these have been sold as a way to stop infection as though this were science.
this was never true and that fact was known and knowable.
let's look.
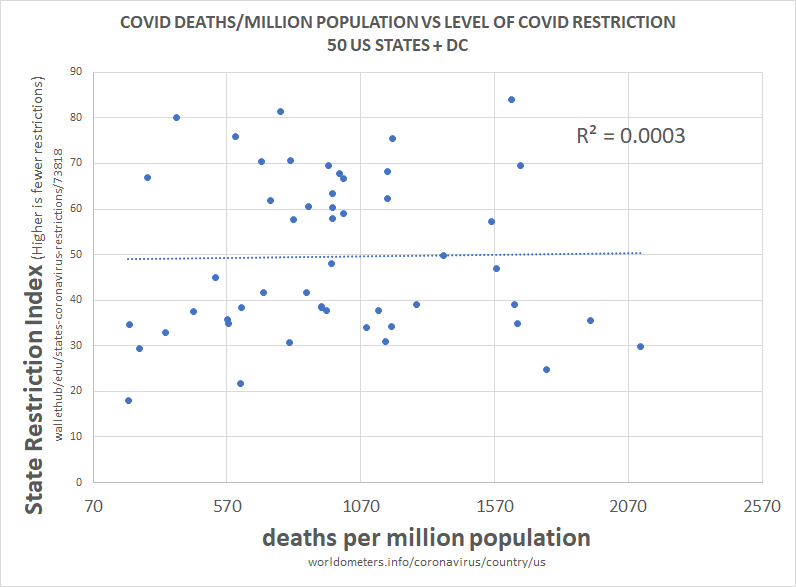
above is the plot of social restriction and NPI vs total death per million. there is 0 R2. this means that the variables play no role in explaining one another.
we can see this same relationship between NPI and all cause deaths.
this is devastating to the case for NPI.
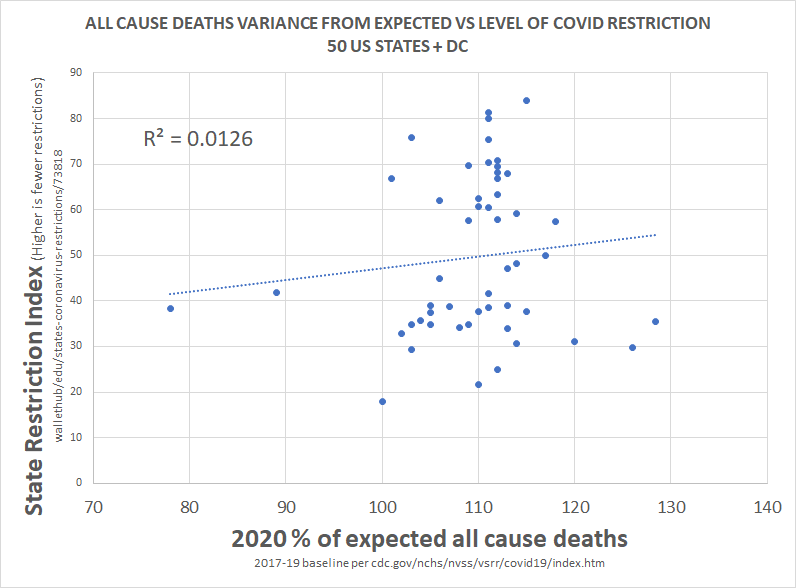
clearly, correlation is not proof of causality, but a total lack of correlation IS proof that there was no material causality.
barring massive and implausible coincidence, it's essentially impossible to cause something and not correlate to it, especially 51 times.
this would seem to pose some very serious questions for those claiming that lockdowns work, those basing policy upon them, and those claiming this is the side of science.
there is no science here nor any data. this is the febrile imaginings of discredited modelers.
this has been clear and obvious from all over the world since the beginning and had been proven so clearly by may that it's hard to imagine anyone who is actually conversant with the data still believing in these responses.
everyone got the same R
these have been sold as a way to stop infection as though this were science.
this was never true and that fact was known and knowable.
let's look.
above is the plot of social restriction and NPI vs total death per million. there is 0 R2. this means that the variables play no role in explaining one another.
we can see this same relationship between NPI and all cause deaths.
this is devastating to the case for NPI.
clearly, correlation is not proof of causality, but a total lack of correlation IS proof that there was no material causality.
barring massive and implausible coincidence, it's essentially impossible to cause something and not correlate to it, especially 51 times.
this would seem to pose some very serious questions for those claiming that lockdowns work, those basing policy upon them, and those claiming this is the side of science.
there is no science here nor any data. this is the febrile imaginings of discredited modelers.
this has been clear and obvious from all over the world since the beginning and had been proven so clearly by may that it's hard to imagine anyone who is actually conversant with the data still believing in these responses.
everyone got the same R
this methodology is a little complex, so let me explain what i did.
— el gato malo (@boriquagato) May 30, 2020
a few EU countries provide real day of death data. this lets us plot meaningful curves to show rate of disease change.
what struck me is how similar all the curves were.
everyone got the same shape. pic.twitter.com/bN0hILzoSl


I've seen many news articles cite that "the UK variant could be the dominant strain by March". This is emphasized by @CDCDirector.
While this will likely to be the case, this should not be an automatic cause for concern. Cases could still remain contained.
Here's how: 🧵
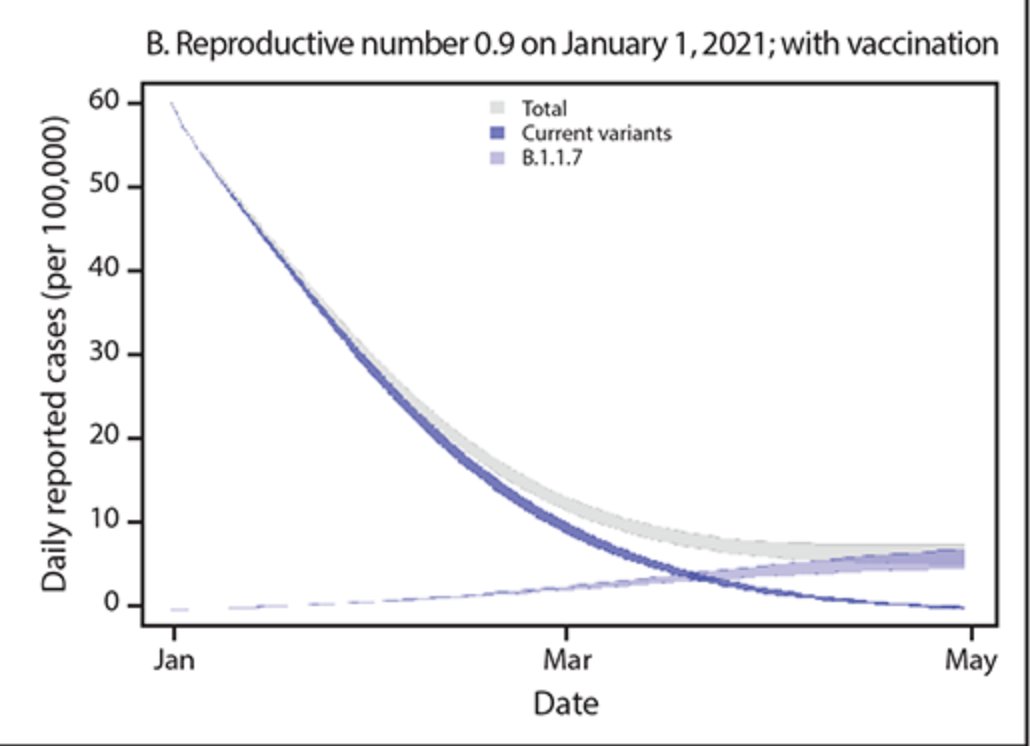
One of @CDCgov's own models has tracked the true decline in cases quite accurately thus far.
Their projection shows that the B.1.1.7 variant will become the dominant variant in March. But interestingly... there's no fourth wave. Cases simply level out:
https://t.co/tDce0MwO61
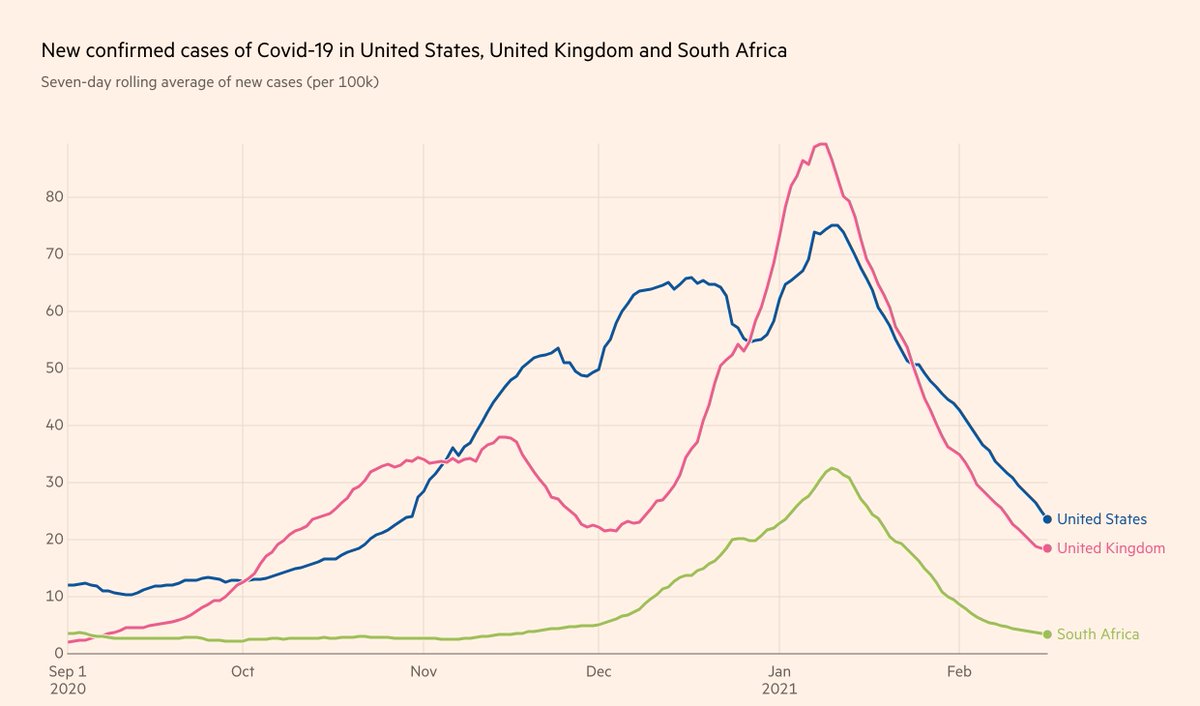
Just because a variant becomes the dominant strain does not automatically mean we will see a repeat of Fall 2020.
Let's look at UK and South Africa, where cases have been falling for the past month, in unison with the US (albeit with tougher restrictions):
Furthermore, the claim that the "variant is doubling every 10 days" is false. It's the *proportion of the variant* that is doubling every 10 days.
If overall prevalence drops during the studied time period, the true doubling time of the variant is actually much longer 10 days.
Simple example:
Day 0: 10 variant / 100 cases -> 10% variant
Day 10: 15 variant / 75 cases -> 20% variant
Day 20: 20 variant / 50 cases -> 40% variant
1) Proportion of variant doubles every 10 days
2) Doubling time of variant is actually 20 days
3) Total cases still drop by 50%
While this will likely to be the case, this should not be an automatic cause for concern. Cases could still remain contained.
Here's how: 🧵
One of @CDCgov's own models has tracked the true decline in cases quite accurately thus far.
Their projection shows that the B.1.1.7 variant will become the dominant variant in March. But interestingly... there's no fourth wave. Cases simply level out:
https://t.co/tDce0MwO61
Just because a variant becomes the dominant strain does not automatically mean we will see a repeat of Fall 2020.
Let's look at UK and South Africa, where cases have been falling for the past month, in unison with the US (albeit with tougher restrictions):
Furthermore, the claim that the "variant is doubling every 10 days" is false. It's the *proportion of the variant* that is doubling every 10 days.
If overall prevalence drops during the studied time period, the true doubling time of the variant is actually much longer 10 days.
Simple example:
Day 0: 10 variant / 100 cases -> 10% variant
Day 10: 15 variant / 75 cases -> 20% variant
Day 20: 20 variant / 50 cases -> 40% variant
1) Proportion of variant doubles every 10 days
2) Doubling time of variant is actually 20 days
3) Total cases still drop by 50%