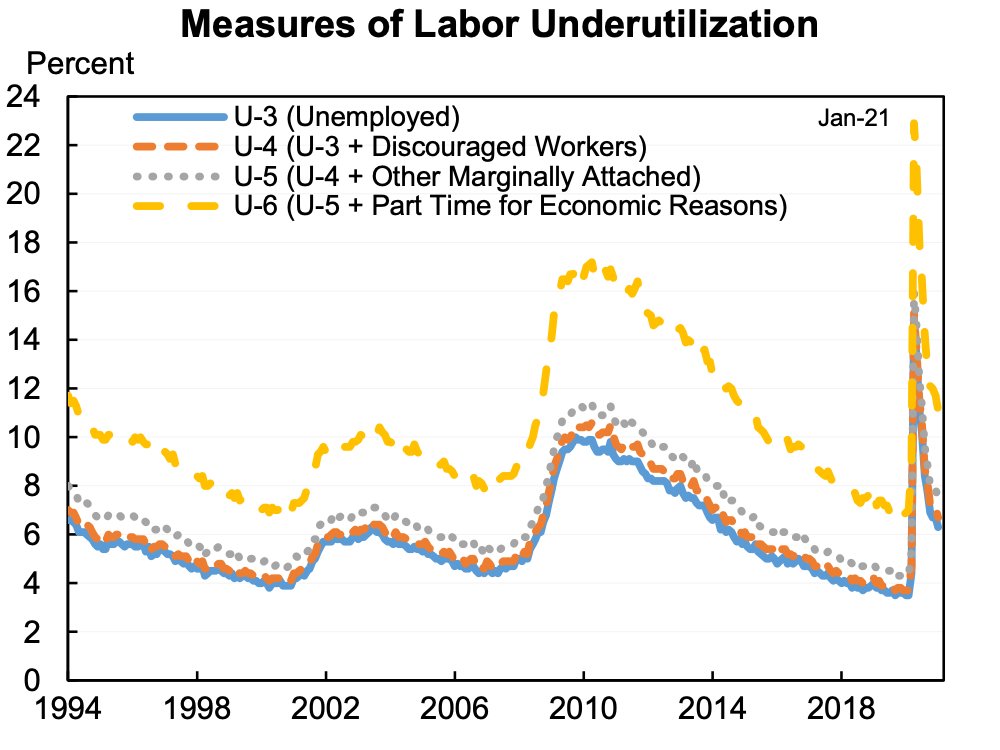
U-6 is 11.1%, it adds in "marginally attached" (discouraged workers & would take a job if it came along) and involuntary part-time.
I've gotten questions about whether to emphasize U-6 as the "true unemployment rate". It is currently 11.1%.
I don't because I think the concept doesn't add much, it misses how unusually bad the labor market is now, is analytically flawed, and can be misleading.
Thread:
U-6 is 11.1%, it adds in "marginally attached" (discouraged workers & would take a job if it came along) and involuntary part-time.
Also shift based on convenience (e.g., Trump shifted from Obama economy bad using U-6 to his good with U-3).
Jay Powell cited an unemployment rate of 10% adjusted for participation. Willie Powell & I have been using 8.3% as the "realistic unemployment rate". Both are correct, both are useful, I won't be offended if you use his instead of mind, but a technical note on the differences.
— Jason Furman (@jasonfurman) February 10, 2021
More from Society


This is a piece I've been thinking about for a long time. One of the most dominant policy ideas in Washington is that policy should, always and everywhere, move parents into paid labor. But what if that's wrong?
My reporting here convinced me that there's no large effect in either direction on labor force participation from child allowances. Canada has a bigger one than either Romney or Biden are considering, and more labor force participation among women.
But what if that wasn't true?
Forcing parents into low-wage, often exploitative, jobs by threatening them and their children with poverty may be counted as a success by some policymakers, but it’s a sign of a society that doesn’t value the most essential forms of labor.
The problem is in the very language we use. If I left my job as a New York Times columnist to care for my 2-year-old son, I’d be described as leaving the labor force. But as much as I adore him, there is no doubt I’d be working harder. I wouldn't have stopped working!
I tried to render conservative objections here fairly. I appreciate that @swinshi talked with me, and I'm sorry I couldn't include everything he said. I'll say I believe I used his strongest arguments, not more speculative ones, in the piece.
I appreciate his intellectual curiosity and effort. I have quibbles. But my big disappointment is there was no mention of unintended consequences, which we discussed and which are kind of THE core conservative concern on this issue.
— \U0001d682\U0001d68c\U0001d698\U0001d69d\U0001d69d \U0001d686\U0001d692\U0001d697\U0001d69c\U0001d691\U0001d692\U0001d699 (@swinshi) February 18, 2021