
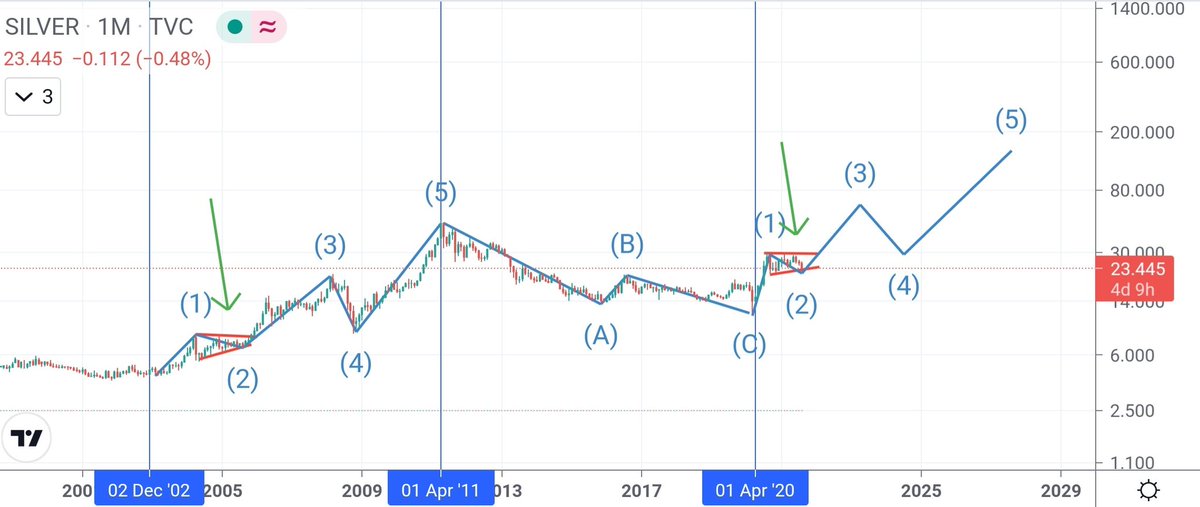
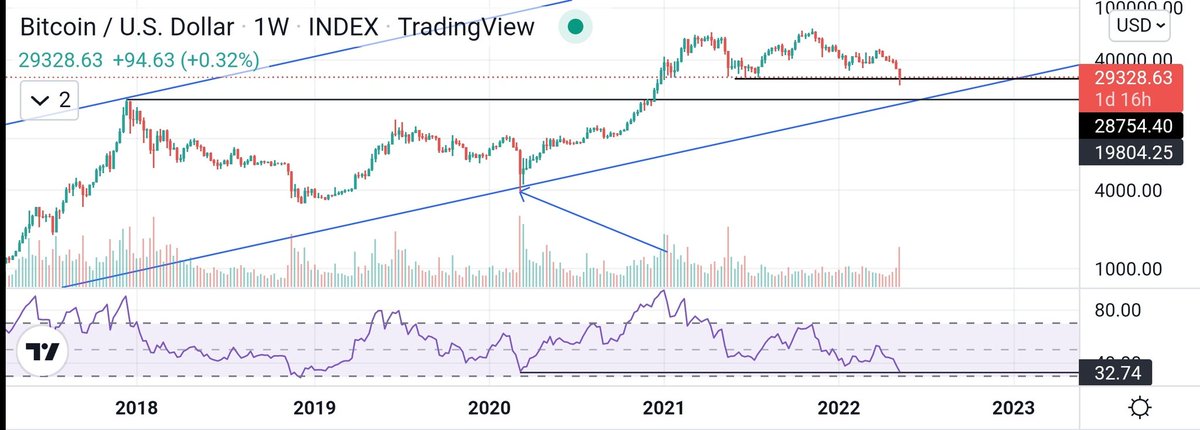
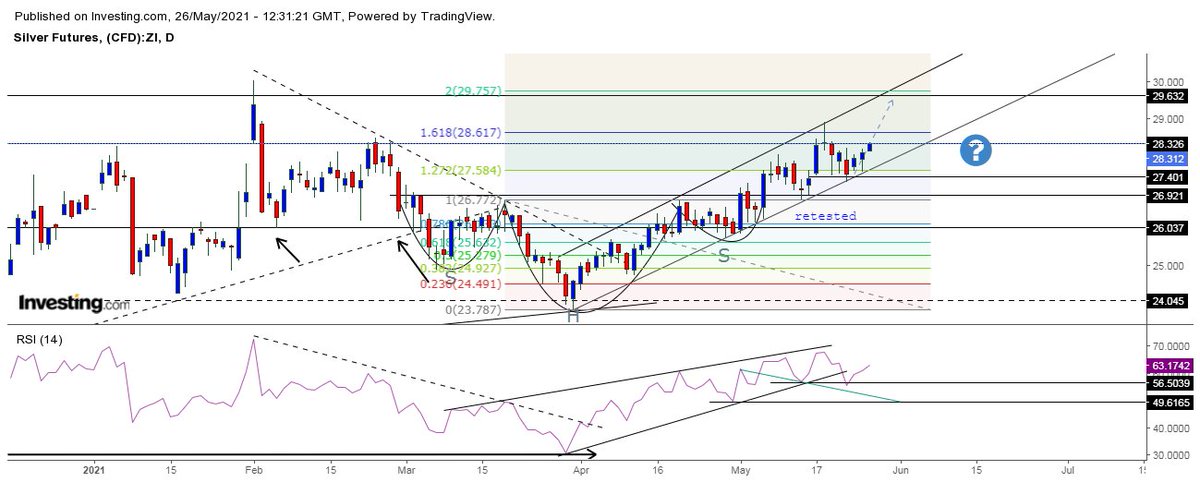
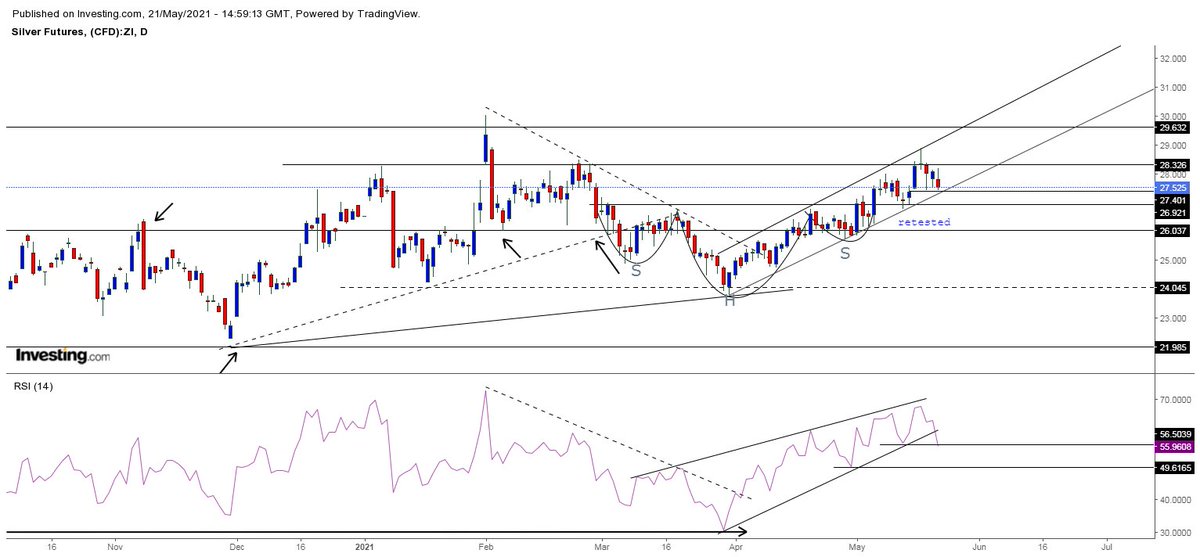
#Silver
Long term monthly chart.
Is silver setting up for something huge?
Last time 5-wave move resulted in 10x (2002-2011), followed by 9 years correction.
More from Mayank Narula
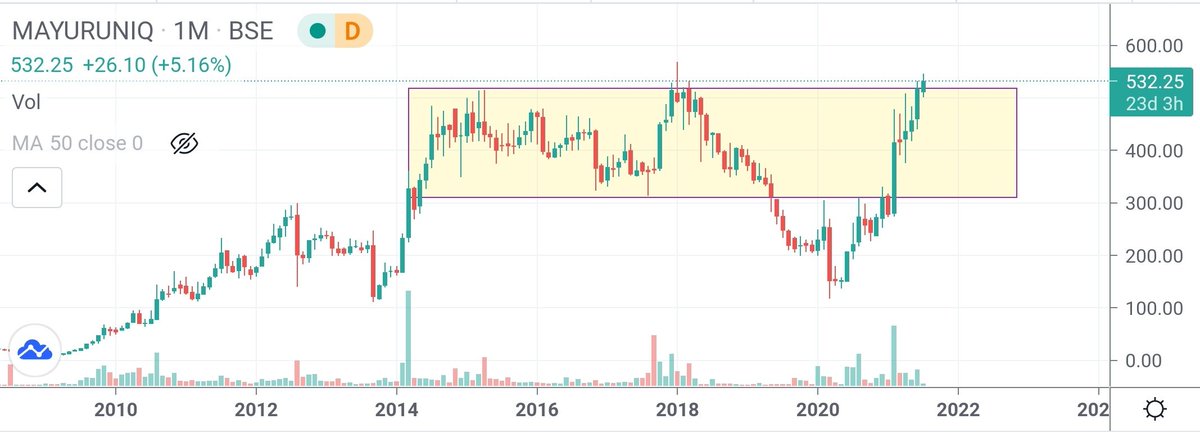
Here is one more stock displaying similar characteristics: Mayur Uniquoters.
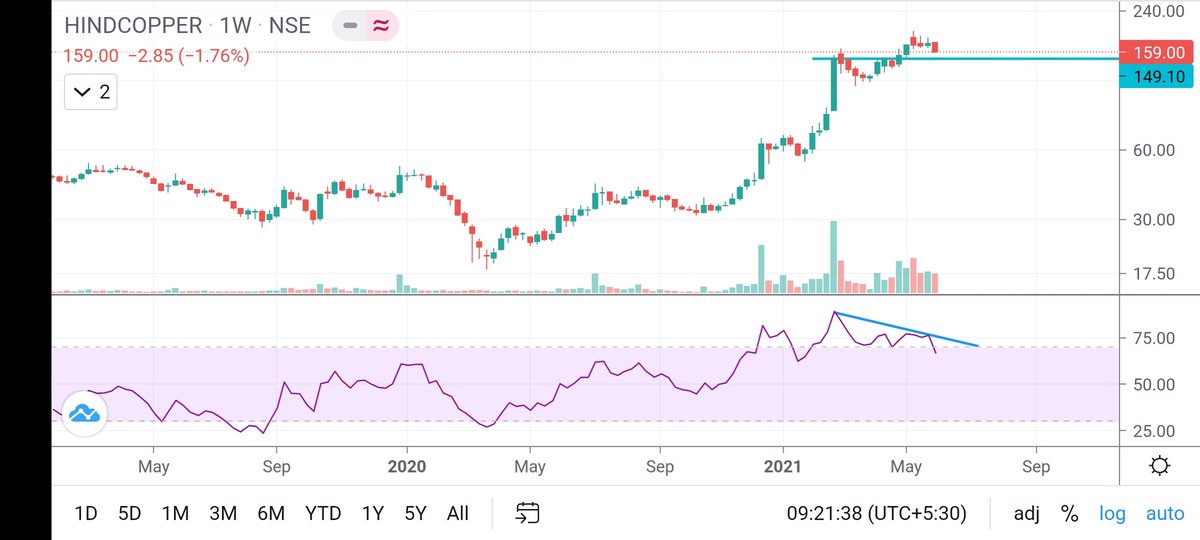
Spot the similarities here in the price action:#AARTIDRUGS
— Mayank Narula (@Mayank_Narula1) October 10, 2020
2013-2015: Monthly RSI goes over 70 and stock goes up 4-5x.
2015-2020: range consolidation
2020: repeat of 2013-15 in few months pic.twitter.com/53L2fNpJoM
#MayurUniq
Coming out of 7 years consolidation.
Weekly and monthly RSI crossing over 70.
Can it do what Aarti Drugs and Tata Elxsi did in last 1 year?
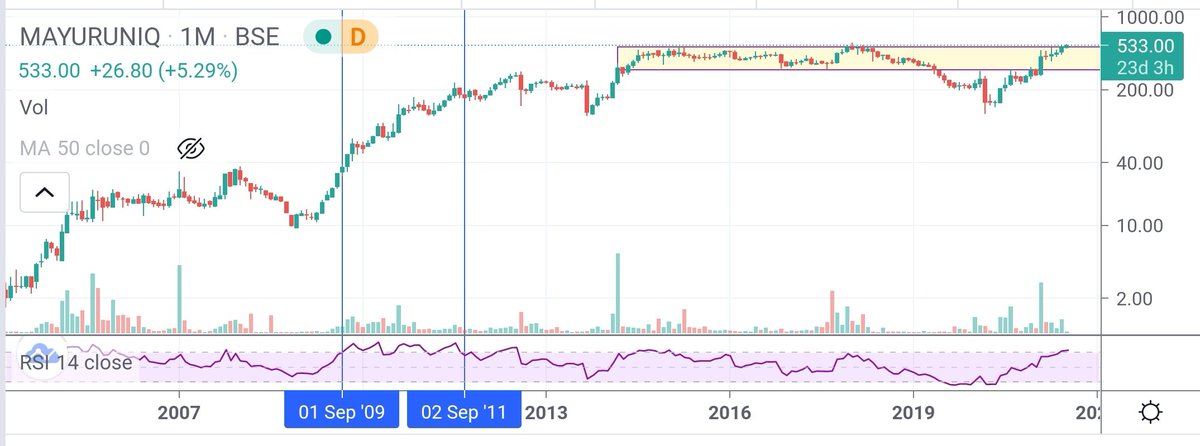
#MayurUniq
Monthly RSI crossed over 70 in Sep'09 and stayed till Sep'11.
Stock did 5x in that time.

More from Silver


You May Also Like

Where to begin?
So our new Secretary of State Anthony Blinken's stepfather, Samuel Pisar, was "longtime lawyer and confidant of...Robert Maxwell," Ghislaine Maxwell's Dad.
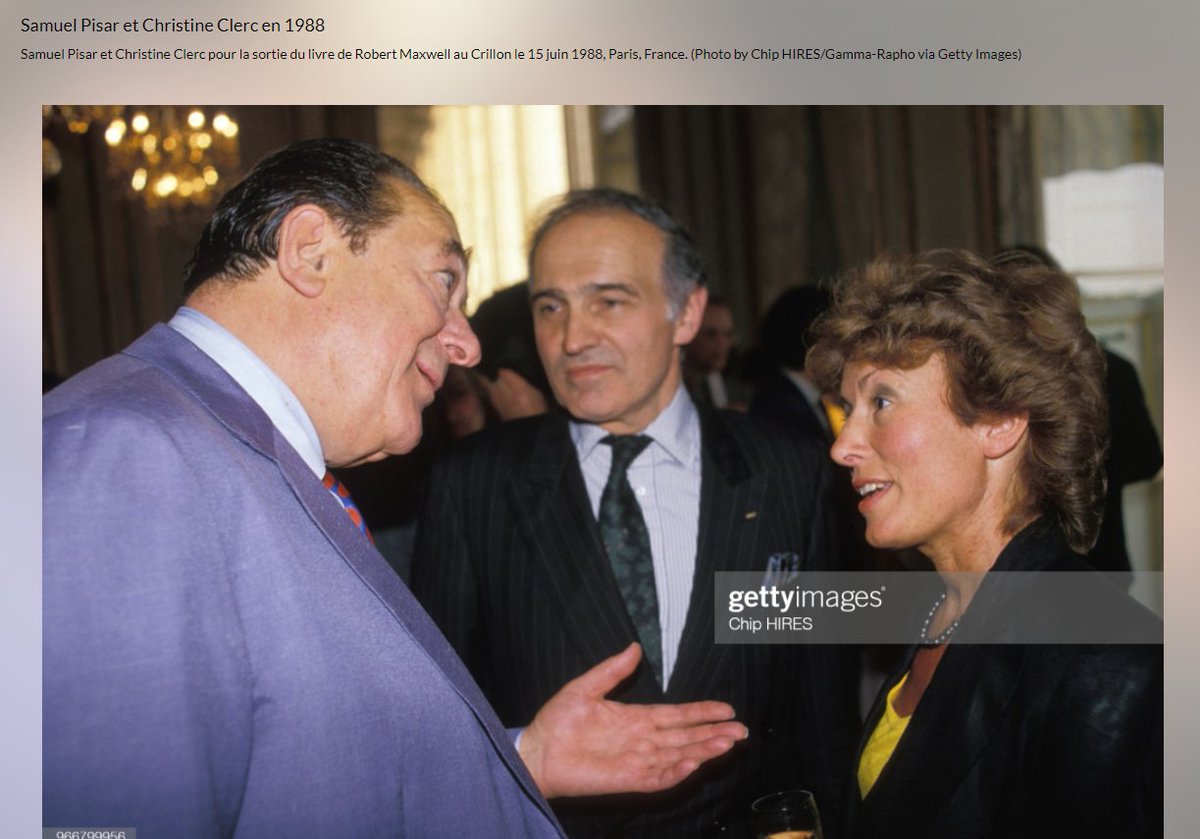
"Pisar was one of the last people to speak to Maxwell, by phone, probably an hour before the chairman of Mirror Group Newspapers fell off his luxury yacht the Lady Ghislaine on 5 November, 1991." https://t.co/DAEgchNyTP

OK, so that's just a coincidence. Moving on, Anthony Blinken "attended the prestigious Dalton School in New York City"...wait, what? https://t.co/DnE6AvHmJg
Dalton School...Dalton School...rings a
Oh that's right.
The dad of the U.S. Attorney General under both George W. Bush & Donald Trump, William Barr, was headmaster of the Dalton School.
Donald Barr was also quite a
Donald Barr had a way with words. pic.twitter.com/JdRBwXPhJn
— Rudy Havenstein, listening to Nas all day. (@RudyHavenstein) September 17, 2020
I'm not going to even mention that Blinken's stepdad Sam Pisar's name was in Epstein's "black book."
Lots of names in that book. I mean, for example, Cuomo, Trump, Clinton, Prince Andrew, Bill Cosby, Woody Allen - all in that book, and their reputations are spotless.


These setups I found from the following 4 accounts:
1. @Pathik_Trader
2. @sourabhsiso19
3. @ITRADE191
4. @DillikiBiili
Share for the benefit of everyone.
Here are the setups from @Pathik_Trader Sir first.
1. Open Drive (Intraday Setup explained)
#OpenDrive#intradaySetup
— Pathik (@Pathik_Trader) April 16, 2019
Sharing one high probability trending setup for intraday.
Few conditions needs to be met
1. Opening should be above/below previous day high/low for buy/sell setup.
2. Open=low (for buy)
Open=high (for sell)
(1/n)
Bactesting results of Open Drive
Already explained strategy of #opendrive
— Pathik (@Pathik_Trader) May 27, 2020
Backtested results in 30 stocks and nifty, banknifty.
Success ratio : approx 40-45%
RR average 1:2
Entry as per strategy
Stoploss = Open level
Exit 3:15 PM Or SL
39 months 14 months -ve, 25 +ve
Yearly all 4 years +ve performance. pic.twitter.com/nGqhzMKGVy
2. Two Price Action setups to get good long side trade for intraday.
1. PDC Acts as Support
2. PDH Acts as
So today we will discuss two more price action setups to get good long side trade for intraday.
— Pathik (@Pathik_Trader) June 20, 2020
1. PDC Acts as Support
2. PDH Acts as Support
Example of PDC/PDH Setup given
#nifty
— Pathik (@Pathik_Trader) June 23, 2020
This is how it created long setup by taking support at PDC.
hopefully shared setup on last weekend helped. pic.twitter.com/2mduSUpMn5

