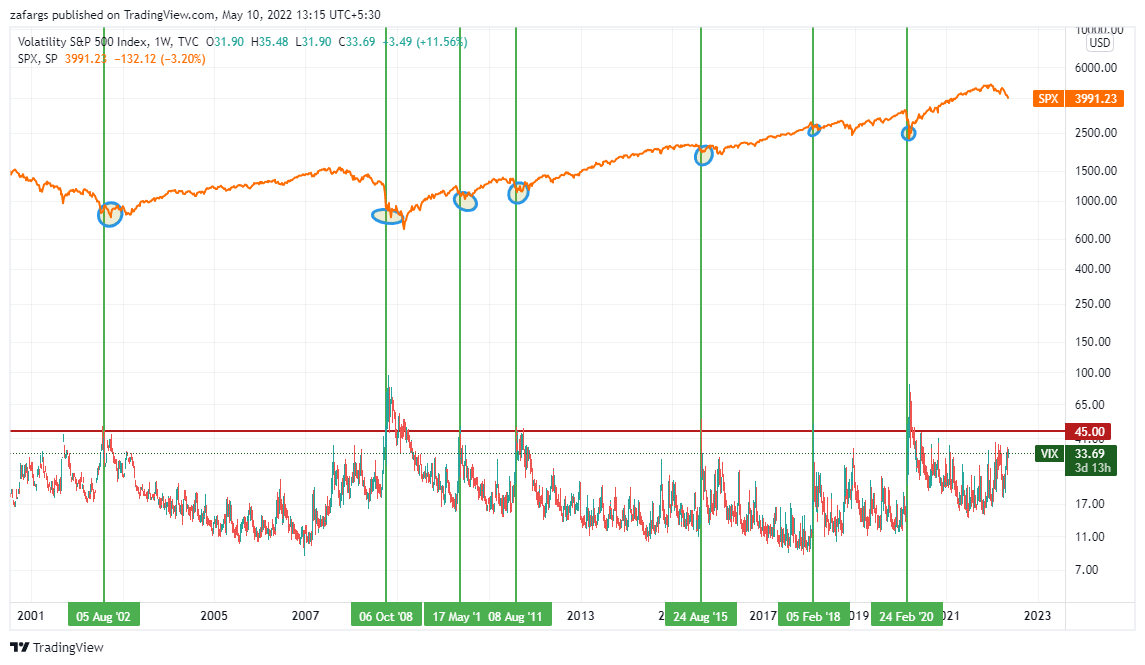
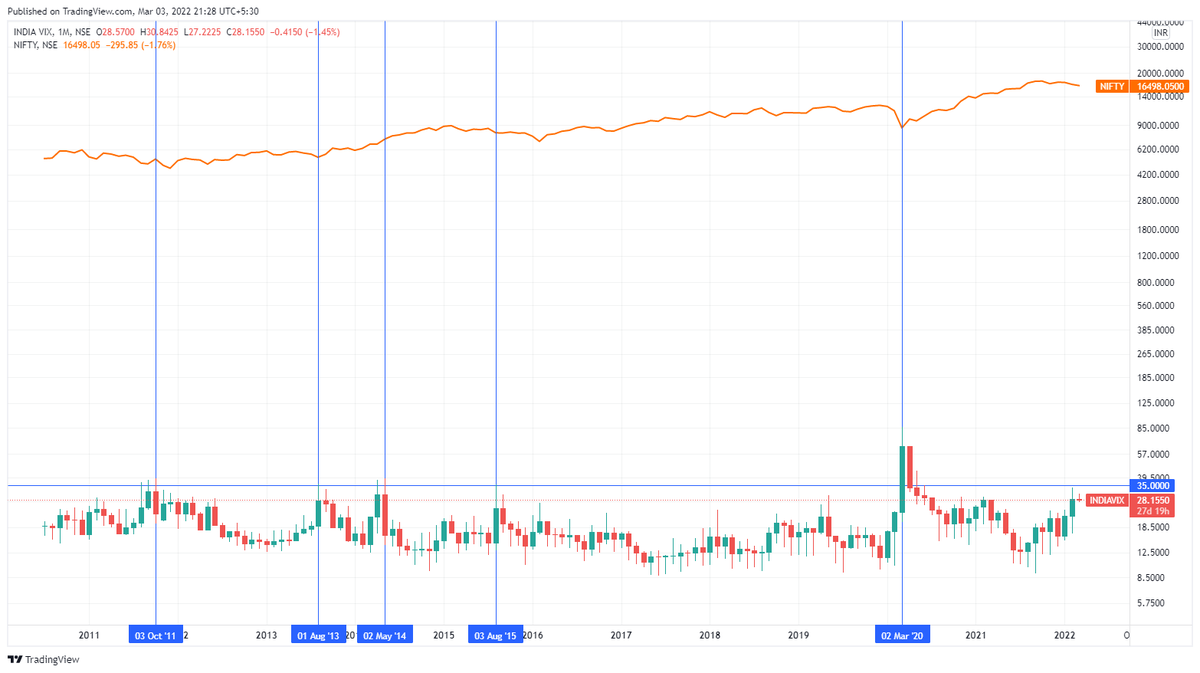
US #VIX vs #SPX
VIX spikes above 30 are common but print above 45 have marked major bottoms
VIX at 33 today, yet to get there
More from Zafar Shaikh
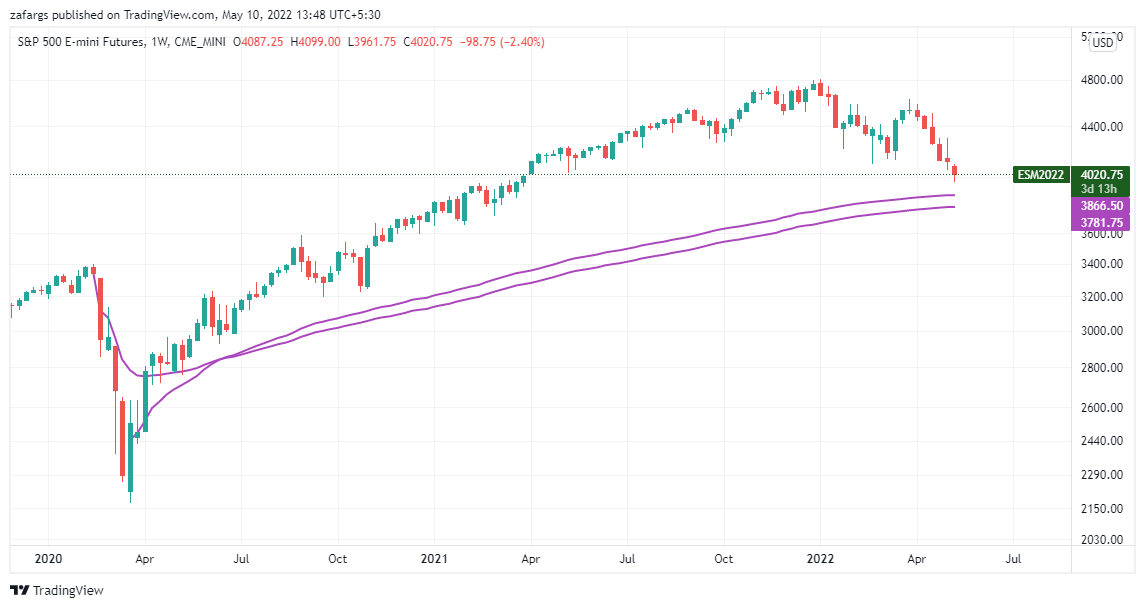
33900 gone on #Banknifty
System says don't buy the dip
Wait for dip of dip of dip at 30500 #Banknifty & 15000 #Nifty
System says don't buy the dip
Wait for dip of dip of dip at 30500 #Banknifty & 15000 #Nifty
#Banknifty 33900-34100 zone has provided Support & bounce multiple times in last 12 months.
— Zafar Shaikh (@InvesysCapital) May 8, 2022
Watch this level carefully in current week. If 33900 goes, would open up big downside towards 30500 in May series ( Which is confluence of multiple support & AVWAP from Mar20 lows) pic.twitter.com/B7KUNkVVSE
1/n
Lot Of People Requested For An Example Of Trend & Pullback System For Directional Trading System Which I Mentioned in Below Tweet. Hence a #Thread.
2/n
I Use Various Combinations Of Time Frame for Trading / Investing. Generally, Time Frame Selected Decides Holding Period Of Trade. For Investment, Quarterly, Monthly & Weekly Time Frames Are Used, Where Holding Period is Few Months To Years.
3/n
Most People Are Generally Interested in Short Term Trading. Hence, Illustrating One System Which I Use For Short Term Stock Futures Trading. Holding Period For These Trades is 2-5 Days. This Example is of Gail Futures Where Taken Long Position Today. Here We Go:-
4/n
Stock Futures Swing Trading Sysem
Time Frames Used :-
Weekly - Stock Selection
Daily - Pullback
Intraday (75Min) - Volatility & Entry Signal
5/n
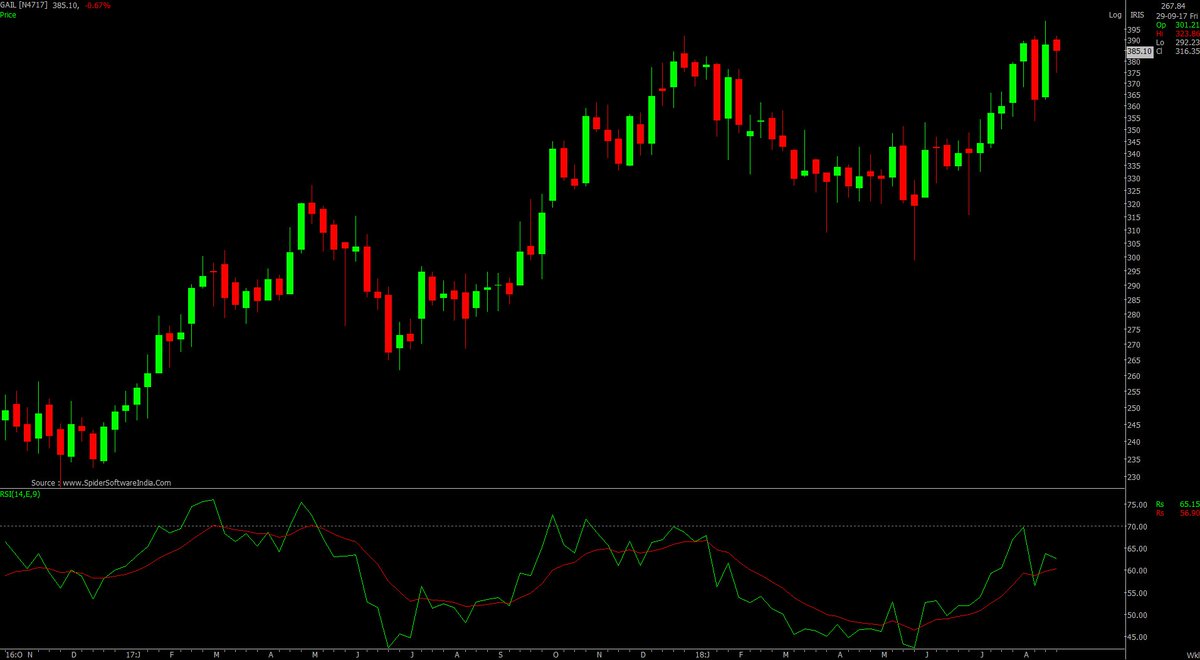
GAIL #WEEKLY-
#StockSelection - GAIL Is Trading Near All Time High. Strong Up Trend. No Brainer. We Can Use RSI To Check Strength. RSI Above 60 is Generally Strong Trend.
Lot Of People Requested For An Example Of Trend & Pullback System For Directional Trading System Which I Mentioned in Below Tweet. Hence a #Thread.
Simple #System I Follow In Trading:
— Zafar Shaikh (@InvesysCapital) August 20, 2018
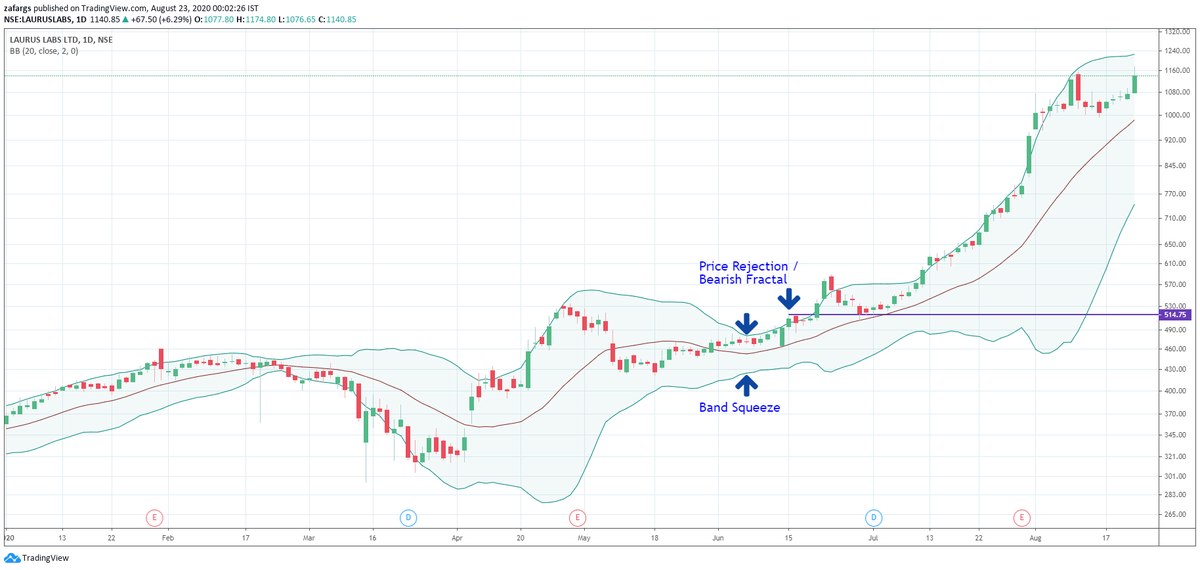
1. Strong #Trend On Higher Timframe
2. #PullBack On Current TimeFrame Against Trend
3. #Contraction Of #Volatility During Pullback
4. #Resumption Of Trend On Lower Time Frame
Gives 60-70% Win Rate & 2:1 Reward Risk#Simple Things #Work
2/n
I Use Various Combinations Of Time Frame for Trading / Investing. Generally, Time Frame Selected Decides Holding Period Of Trade. For Investment, Quarterly, Monthly & Weekly Time Frames Are Used, Where Holding Period is Few Months To Years.
3/n
Most People Are Generally Interested in Short Term Trading. Hence, Illustrating One System Which I Use For Short Term Stock Futures Trading. Holding Period For These Trades is 2-5 Days. This Example is of Gail Futures Where Taken Long Position Today. Here We Go:-
4/n
Stock Futures Swing Trading Sysem
Time Frames Used :-
Weekly - Stock Selection
Daily - Pullback
Intraday (75Min) - Volatility & Entry Signal
5/n
GAIL #WEEKLY-
#StockSelection - GAIL Is Trading Near All Time High. Strong Up Trend. No Brainer. We Can Use RSI To Check Strength. RSI Above 60 is Generally Strong Trend.
More from Screeners


Oil, copper and other commodities came under heavy selling pressure today and that's a good thing because it's mounting evidence that inflation may be peaking.
Positive signs on inflation include fertilizer prices peaking and trending downward. Used Car prices are also down (which led inflation). The recent price break on the $XLE - which emerged almost to the day the market topped, could be an indication that we are close to a low. pic.twitter.com/2MtcKjjmAz
— Mark Minervini (@markminervini) June 23, 2022

Central Pivot Range—(CPR)
What does it mean?
7 tweets that will teach you about its basics (and much more):🧵
Collaborated with @niki_poojary
1/ What is CPR?
The basics of CPR, how it's calculated, and TC and BC in CPR.
User: @ZerodhaVarsity.
One can also gauge the trend whether bullish or bearish.
Explained in very simple words
@ZerodhaVarsity 2/ What are the Uses of CPR?
User: @YMehta_
A thread that provides examples along with the concept.
Also includes an Intraday Trading Setup on 5 min
@ZerodhaVarsity @YMehta_ 3/ How to analyze trends with CPR?
User: @cprbykgs
How to interpret CPR based on the candles forming either above or below the daily and weekly CPR.
He is the most famous guy when it comes to CPR, so go through his Twitter and Youtube
@ZerodhaVarsity @YMehta_ @cprbykgs 4/ Interpreting longer timeframes with CPR
User: @cprbykgs
Trend Reversals with CPR when the trend is bullish and it enters the daily CPR
What does it mean?
7 tweets that will teach you about its basics (and much more):🧵
Collaborated with @niki_poojary
1/ What is CPR?
The basics of CPR, how it's calculated, and TC and BC in CPR.
User: @ZerodhaVarsity.
One can also gauge the trend whether bullish or bearish.
Explained in very simple words
@ZerodhaVarsity 2/ What are the Uses of CPR?
User: @YMehta_
A thread that provides examples along with the concept.
Also includes an Intraday Trading Setup on 5 min
#CPR is an indicator which is used for #Intraday in Stock Market.
— Yash Mehta (@YMehta_) November 19, 2021
This learning thread would be on
"\U0001d650\U0001d668\U0001d65a\U0001d668 \U0001d664\U0001d65b \U0001d63e\U0001d64b\U0001d64d"
Like\u2764\ufe0f& Retweet\U0001f501for wider reach and for more such learning thread in the future.
Also, an investment strategy is shared using CPR in the end.
1/24
@ZerodhaVarsity @YMehta_ 3/ How to analyze trends with CPR?
User: @cprbykgs
How to interpret CPR based on the candles forming either above or below the daily and weekly CPR.
He is the most famous guy when it comes to CPR, so go through his Twitter and Youtube
CPR indicator trend analysis:
— Gomathi Shankar (@cprbykgs) January 25, 2022
Candles below daily & weekly CPR \U0001f43b
Candles above daily CPR but below weekly CPR early confirmation of \U0001f402
Candles above daily + weekly CPR strong confirmation of \U0001f402
Isn\u2019t it simple?#cprbykgs #cprindicator #nifty #banknifty
@ZerodhaVarsity @YMehta_ @cprbykgs 4/ Interpreting longer timeframes with CPR
User: @cprbykgs
Trend Reversals with CPR when the trend is bullish and it enters the daily CPR
#banknifty
— Gomathi Shankar (@cprbykgs) July 9, 2021
Candles above monthly CPR- Bullish
Candles above weekly CPR- Bullish
Now, whenever candles enter daily CPR range it indicates weakness of current trend & early signs of trend reversal.
So, wait for the candles to exit the daily CPR range then take the trade. (1/4) pic.twitter.com/7vaaLMCrV8