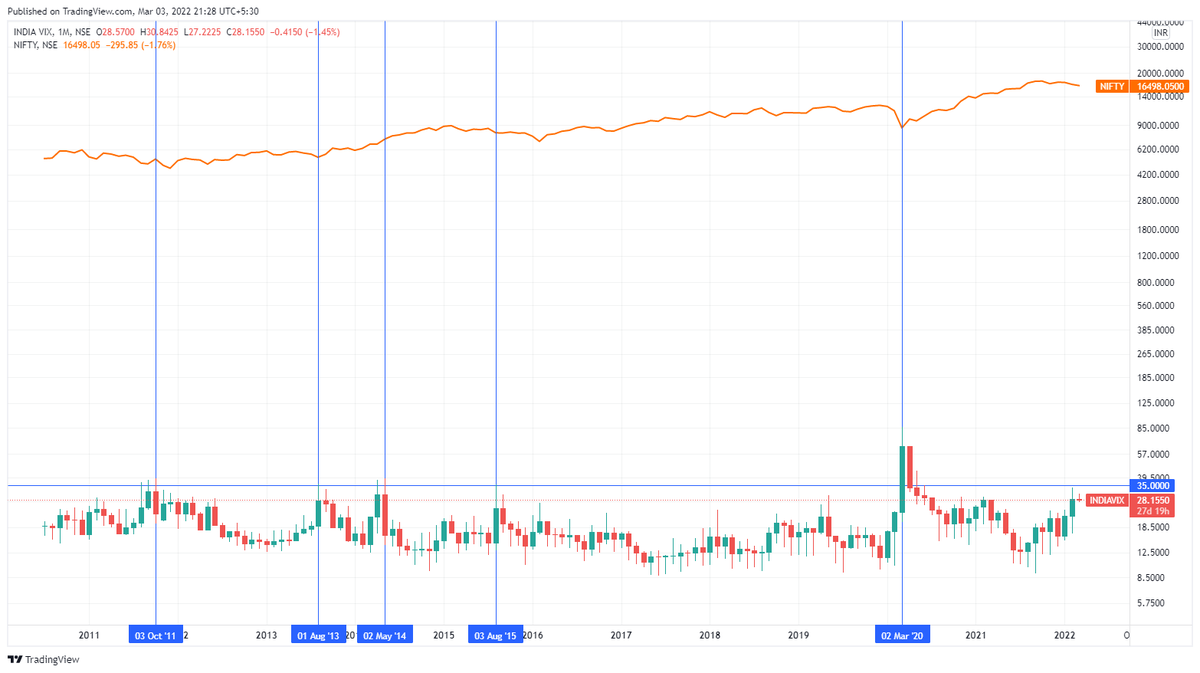
#INDIAVIX print above 35 has been good time for investment in last 10 yrs of Market
Feb VIX printed 30 . If it spikes further in March, can be good time for catching falling knives in Stocks.
More from Zafar Shaikh
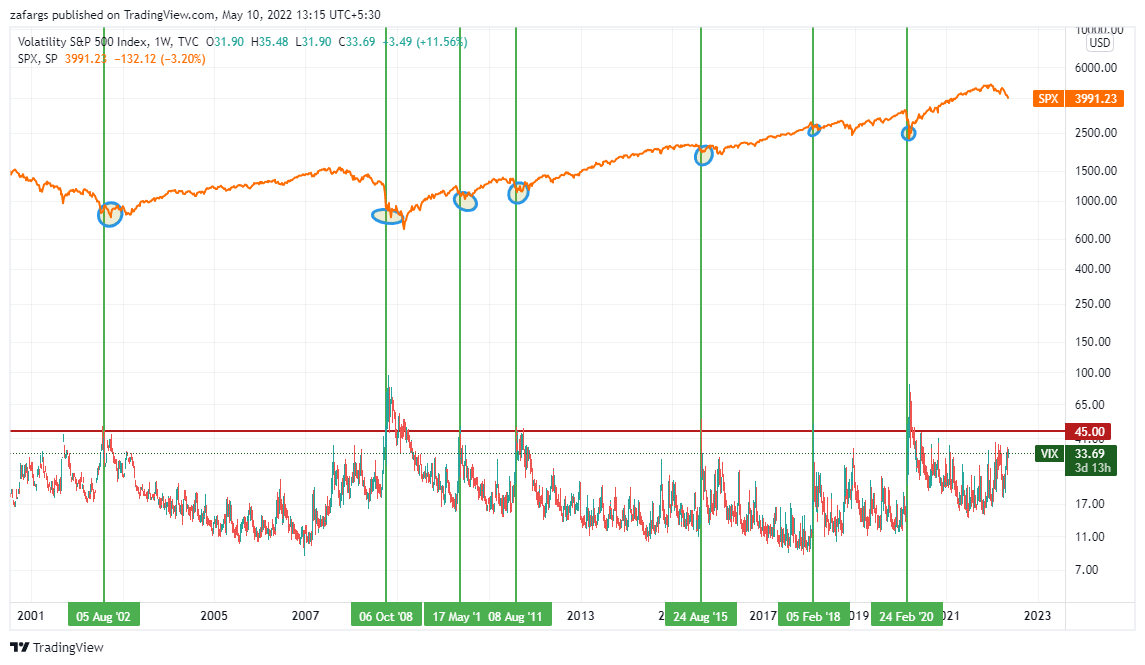
Lot Of People Requested For An Example Of Trend & Pullback System For Directional Trading System Which I Mentioned in Below Tweet. Hence a #Thread.
Simple #System I Follow In Trading:
— Zafar Shaikh (@InvesysCapital) August 20, 2018
1. Strong #Trend On Higher Timframe
2. #PullBack On Current TimeFrame Against Trend
3. #Contraction Of #Volatility During Pullback
4. #Resumption Of Trend On Lower Time Frame
Gives 60-70% Win Rate & 2:1 Reward Risk#Simple Things #Work
2/n
I Use Various Combinations Of Time Frame for Trading / Investing. Generally, Time Frame Selected Decides Holding Period Of Trade. For Investment, Quarterly, Monthly & Weekly Time Frames Are Used, Where Holding Period is Few Months To Years.
3/n
Most People Are Generally Interested in Short Term Trading. Hence, Illustrating One System Which I Use For Short Term Stock Futures Trading. Holding Period For These Trades is 2-5 Days. This Example is of Gail Futures Where Taken Long Position Today. Here We Go:-
4/n
Stock Futures Swing Trading Sysem
Time Frames Used :-
Weekly - Stock Selection
Daily - Pullback
Intraday (75Min) - Volatility & Entry Signal
5/n
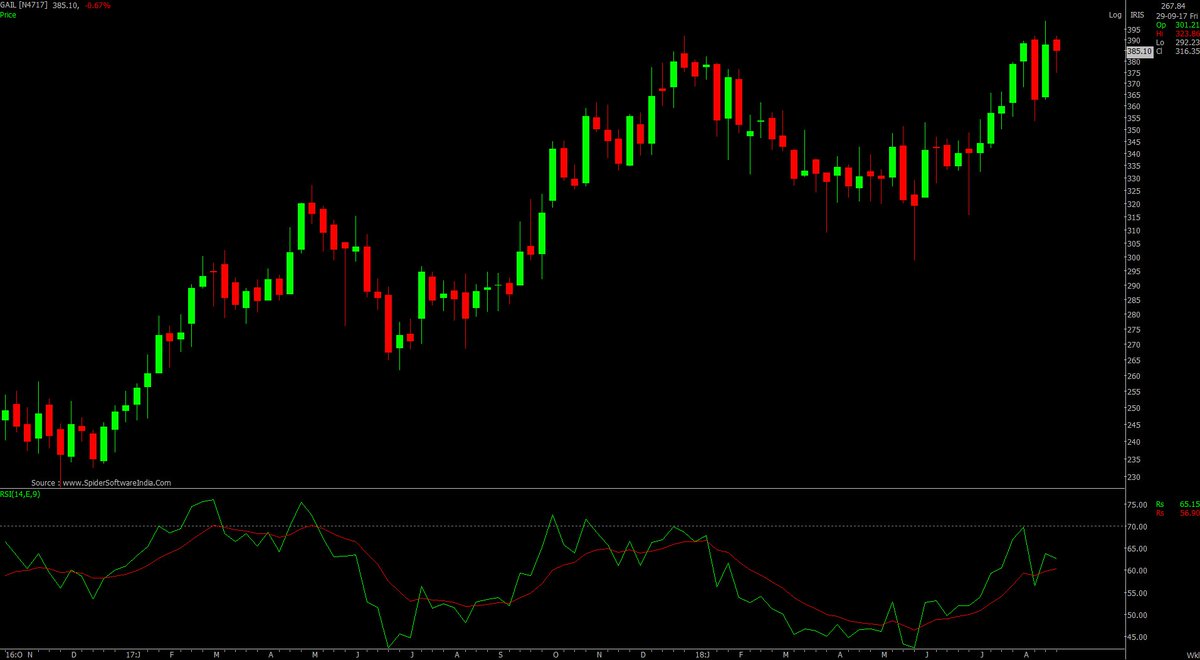
GAIL #WEEKLY-
#StockSelection - GAIL Is Trading Near All Time High. Strong Up Trend. No Brainer. We Can Use RSI To Check Strength. RSI Above 60 is Generally Strong Trend.
System says don't buy the dip
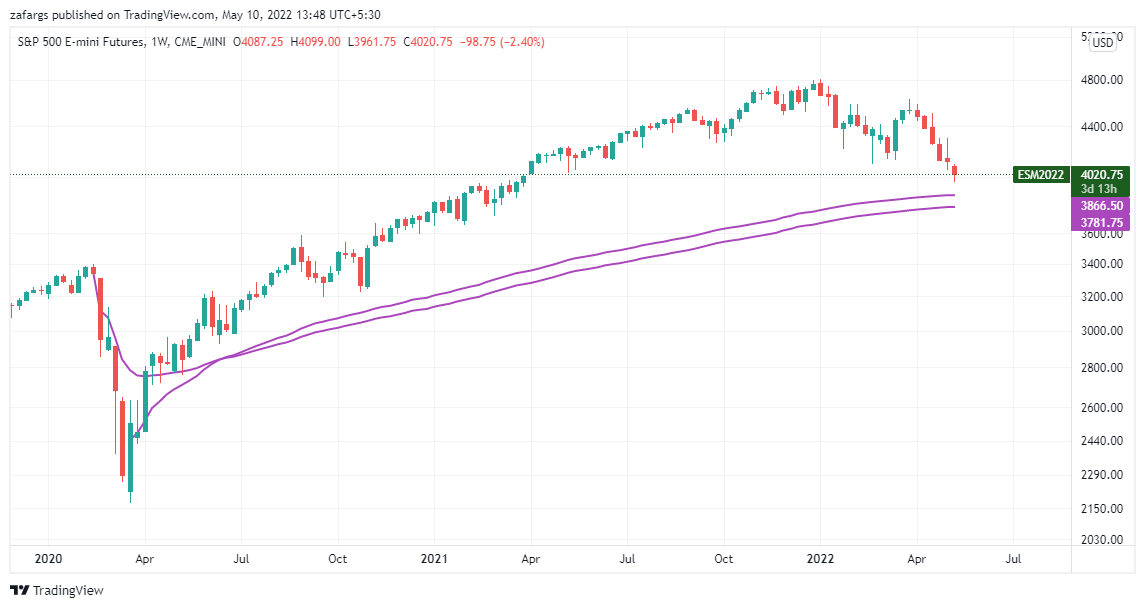
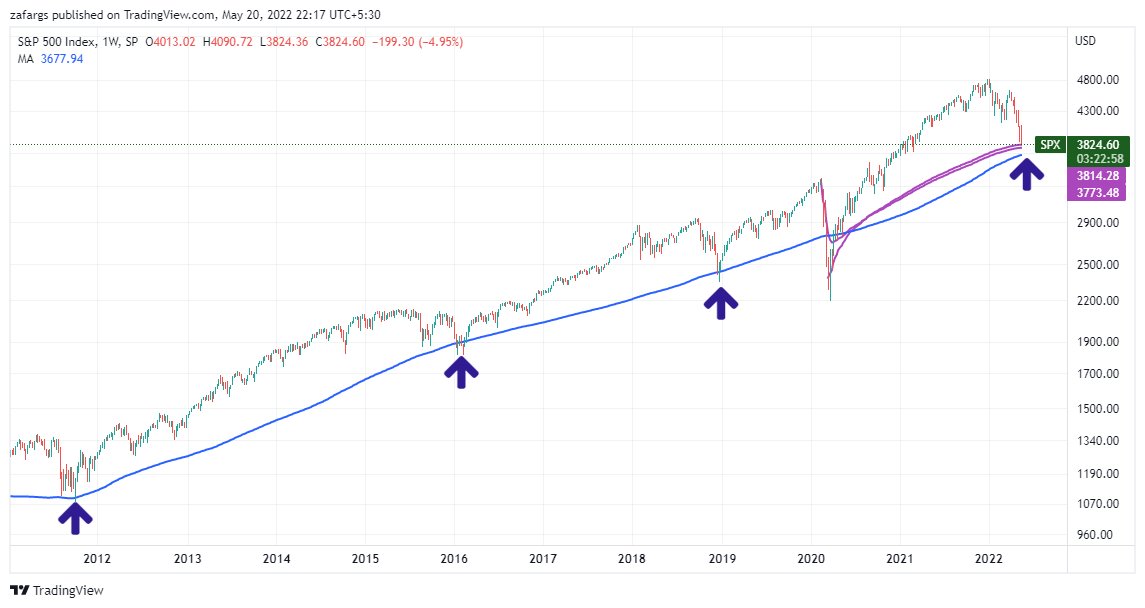
Wait for dip of dip of dip at 30500 #Banknifty & 15000 #Nifty
#Banknifty 33900-34100 zone has provided Support & bounce multiple times in last 12 months.
— Zafar Shaikh (@InvesysCapital) May 8, 2022
Watch this level carefully in current week. If 33900 goes, would open up big downside towards 30500 in May series ( Which is confluence of multiple support & AVWAP from Mar20 lows) pic.twitter.com/B7KUNkVVSE


More from Screeners



A thread on some features that will help you trade and invest better😀👇
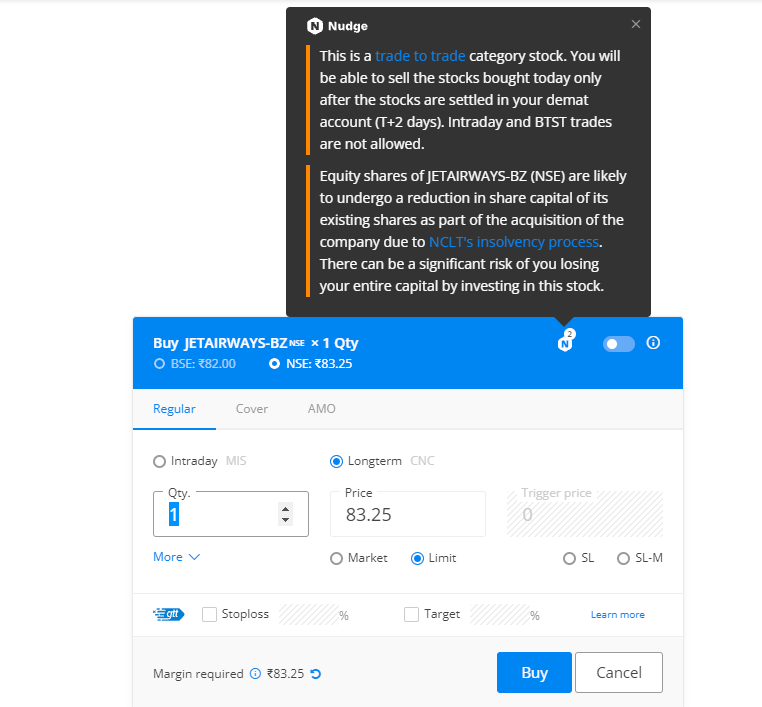
With Nudges, our aim is to help users avoid mistakes at the point of decision-making. We’ll nudge you when you’re about to make a mistake like buy dubious stocks, trade illiquid scrips, stocks with corporate actions etc. Here are a few Nudges that have helped users the most👇
With GTT, you can place long-standing orders. You can place a target and a stop loss for the stocks you buy so that you don’t have to track the prices every day. The orders will remain active until triggered*🏖
If you trade large quantities of scrips with freeze quantity, for example, you'll have to open the order window each time. With sticky order window, the order form remains open even after you place an order so that you can quickly place multiple
Normally after you place an order, the order window closes. With the Sticky order window, the order window remains open, making it easy to place multiple orders with the same input with just one click\u26a1rather than doing it all over again. This helps overcome qty freeze limits. pic.twitter.com/65kXY4h9f0
— Zerodha (@zerodhaonline) November 15, 2021
With the Positions Analysis tool by @BeSensibull, you can see Max loss, Max profit, Breakeven probability of profit, Greeks, IVs and much more right on Kite.
You can also change the price and expiry to see how much you'll gain or lose.


You May Also Like

Like company moats, your personal moat should be a competitive advantage that is not only durable—it should also compound over time.
Characteristics of a personal moat below:
I'm increasingly interested in the idea of "personal moats" in the context of careers.
— Erik Torenberg (@eriktorenberg) November 22, 2018
Moats should be:
- Hard to learn and hard to do (but perhaps easier for you)
- Skills that are rare and valuable
- Legible
- Compounding over time
- Unique to your own talents & interests https://t.co/bB3k1YcH5b
2/ Like a company moat, you want to build career capital while you sleep.
As Andrew Chen noted:
People talk about \u201cpassive income\u201d a lot but not about \u201cpassive social capital\u201d or \u201cpassive networking\u201d or \u201cpassive knowledge gaining\u201d but that\u2019s what you can architect if you have a thing and it grows over time without intensive constant effort to sustain it
— Andrew Chen (@andrewchen) November 22, 2018
3/ You don’t want to build a competitive advantage that is fleeting or that will get commoditized
Things that might get commoditized over time (some longer than
Things that look like moats but likely aren\u2019t or may fade:
— Erik Torenberg (@eriktorenberg) November 22, 2018
- Proprietary networks
- Being something other than one of the best at any tournament style-game
- Many "awards"
- Twitter followers or general reach without "respect"
- Anything that depends on information asymmetry https://t.co/abjxesVIh9
4/ Before the arrival of recorded music, what used to be scarce was the actual music itself — required an in-person artist.
After recorded music, the music itself became abundant and what became scarce was curation, distribution, and self space.
5/ Similarly, in careers, what used to be (more) scarce were things like ideas, money, and exclusive relationships.
In the internet economy, what has become scarce are things like specific knowledge, rare & valuable skills, and great reputations.


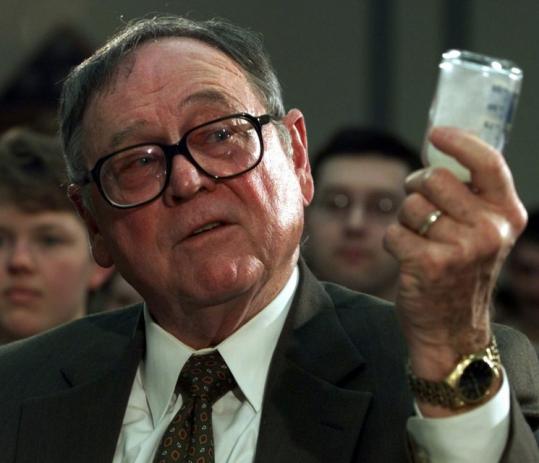
Mr. Patrick, one of the chief scientists at the Army Biological Warfare Laboratories at Fort Detrick in Frederick, Md., held five classified US patents for the process of weaponizing anthrax.
2/x
Under Mr. Patrick’s direction, scientists at Fort Detrick developed a tularemia agent that, if disseminated by airplane, could cause casualties & sickness over 1000s mi². In a 10,000 mi² range, it had 90% casualty rate & 50% fatality rate
3/x His team explored Q fever, plague, & Venezuelan equine encephalitis, testing more than 20 anthrax strains to discern most lethal variety. Fort Detrick scientists used aerosol spray systems inside fountain pens, walking sticks, light bulbs, & even in 1953 Mercury exhaust pipes

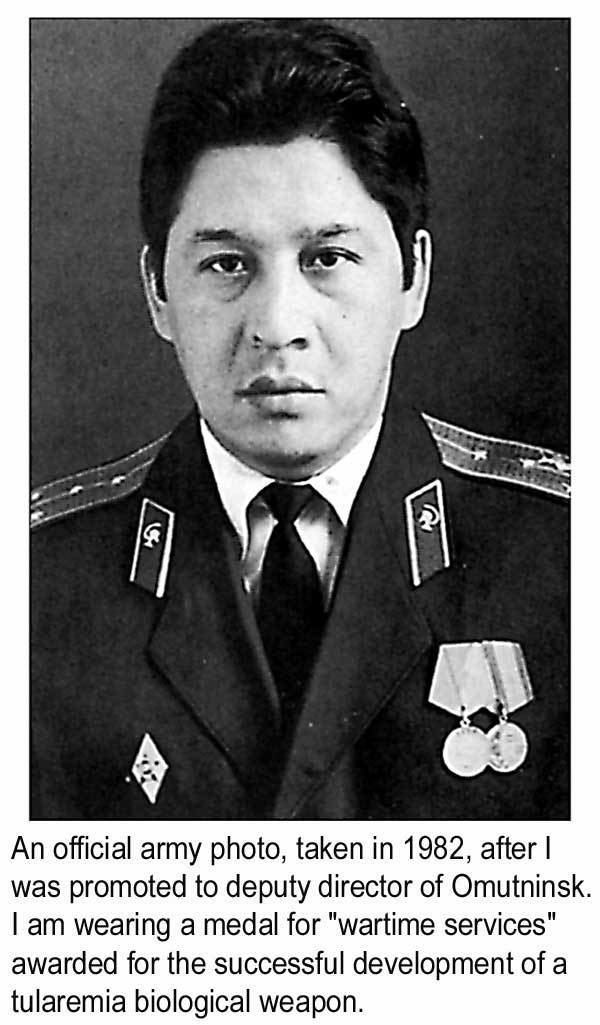
4/x After retiring in 1986, Mr. Patrick remained one of the world’s foremost specialists on biological warfare & was a consultant to the CIA, FBI, & US military. He debriefed Soviet defector Ken Alibek, the deputy chief of the Soviet biowarfare program
https://t.co/sHqSaTSqtB
5/x Back in Time
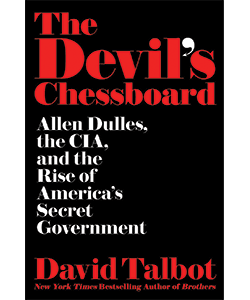
In 1949 the Army created a small team of chemists at "Camp Detrick" called Special Operations Division. Its assignment was to find military uses for toxic bacteria. The coercive use of toxins was a new field, which fascinated Allen Dulles, later head of the CIA


I believe that @ripple_crippler and @looP_rM311_7211 are the same person. I know, nobody believes that. 2/*
Today I want to prove that Mr Pool smile faces mean XRP and price increase. In Ripple_Crippler, previous to Mr Pool existence, smile faces were frequent. They were very similar to the ones Mr Pool posts. The eyes also were usually a couple of "x", in fact, XRP logo. 3/*

The smile XRP-eyed face also appears related to the Moon. XRP going to the Moon. 4/*
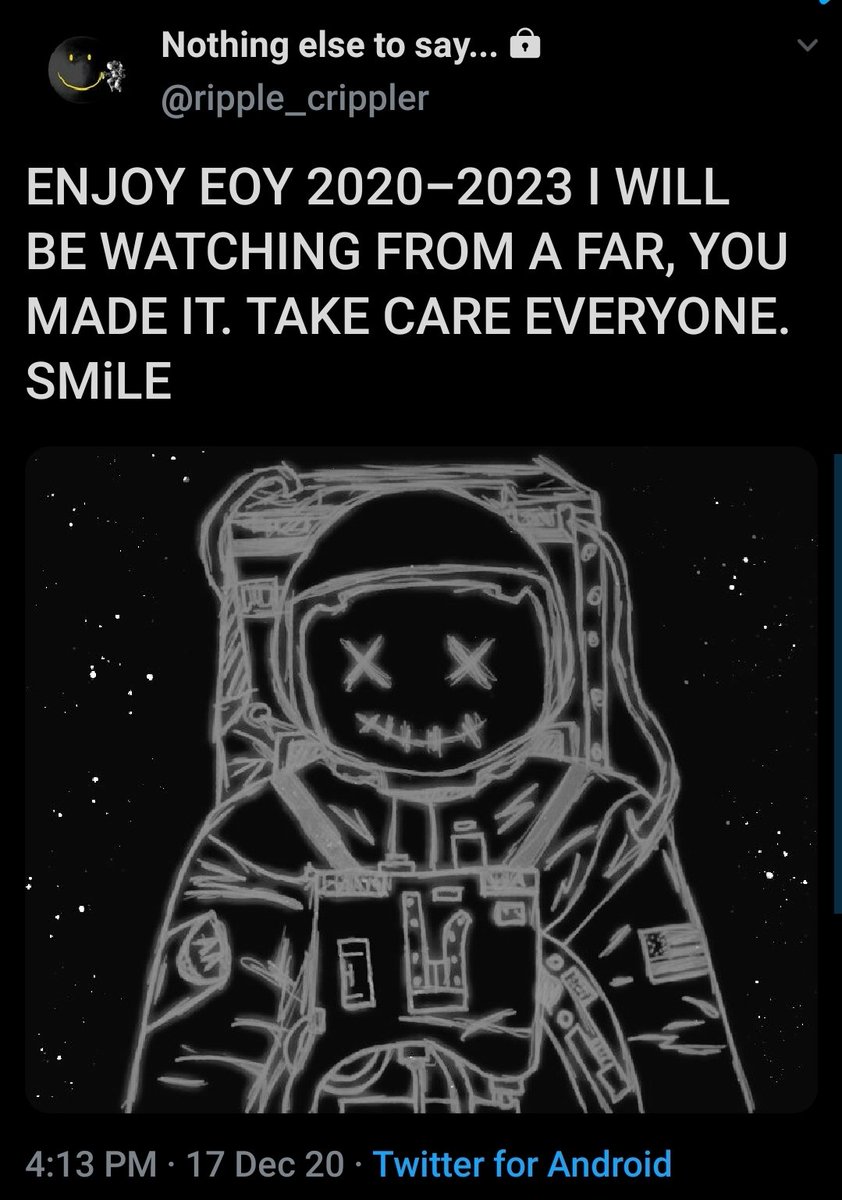
And smile XRP-eyed faces also appear related to Egypt. In particular, to the Eye of Horus. https://t.co/i4rRzuQ0gZ 5/*