IRCTC below 640 today !
Have no intention to enjoy the misery of fellow market participants but 'Maine Bola Tha' !
#ProfGyan - If a freak low gets made some day, Stocks/Indices always try to visit it at least once (seekh lo, mere mentorship course ka launch kuch pukka nahi hai) https://t.co/3B6e2nMx0y
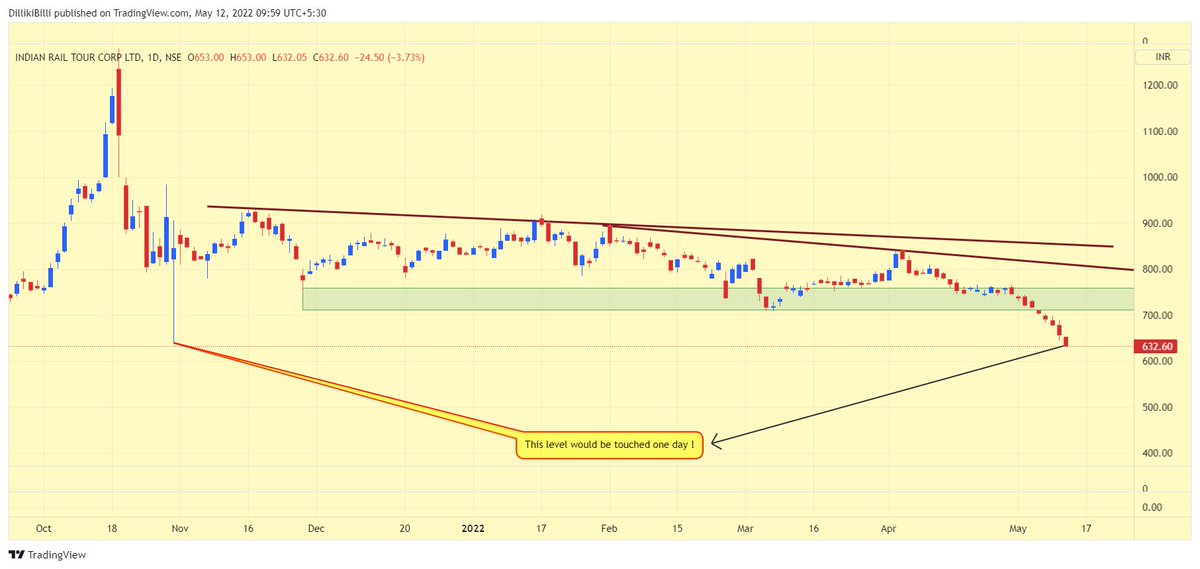
Two prophecies about IRCTC:
— Professor (@DillikiBiili) May 1, 2022
1. It would touch 640 someday
2. It would get expelled from F&O https://t.co/qJ04hG0qFH pic.twitter.com/TPUBSQFW1y
More from Professor

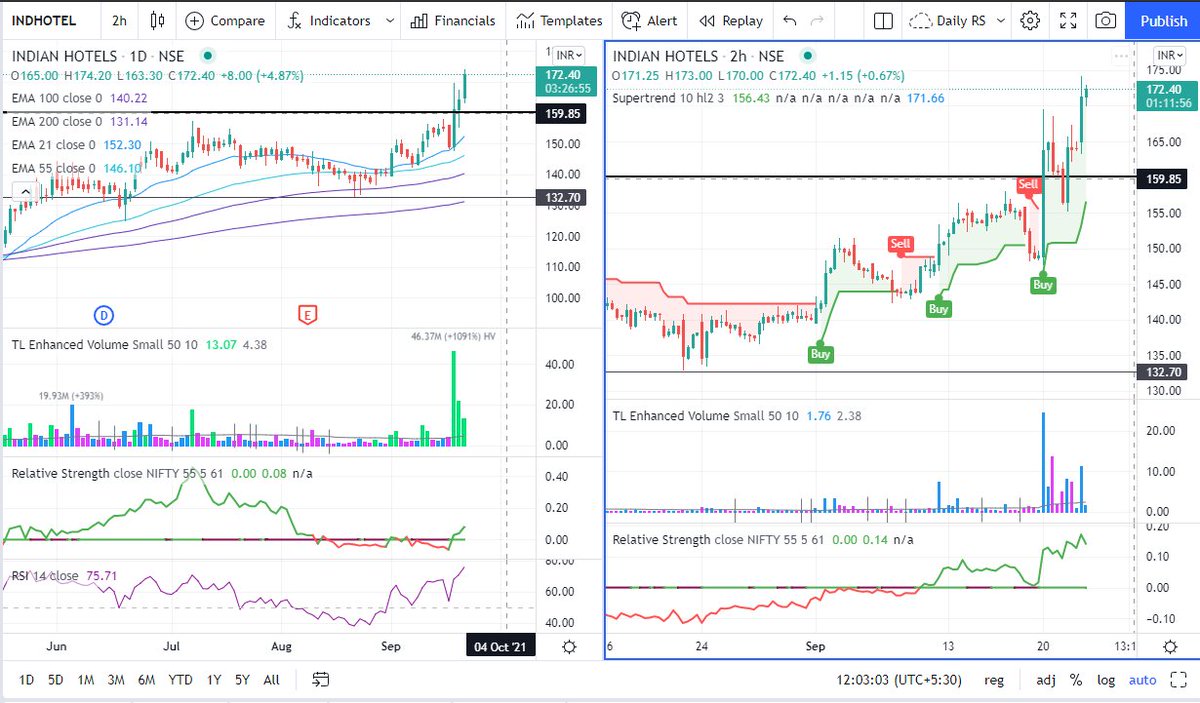
Forgot to mention one point. How to trail profits in Breakout trades.
One of the best way that I know is ATR based trailing.
Here is an example https://t.co/BTATx5fyW6
One of the best way that I know is ATR based trailing.
Here is an example https://t.co/BTATx5fyW6
An example of ATR based TSL.
— Professor (@DillikiBiili) April 9, 2021
SL for coming candle is Low of the just completed candle - ATR of previous candle. Chart is self explanatory. https://t.co/D95iv4t5j6 pic.twitter.com/e8BkO2j5rn