Immediately post the market hours:
~ 2-3 hours to scan the charts
1 hr before the market opening:
~ re-visiting the existing holdings
~ revising the SL
~ prioritizing the watchlist in terms of the most promising setups
~ setting the alerts
More from The_Chartist 📈

Explained you same concept with Elxsi. The real test of a strong Breakout is that the big hand will not give you another chance to buy the share at the breakout level. They will absorb all the selling of weak hands. I mean "STRONG breakout". https://t.co/7fxFqGQl3p
Tata Elxsi ---
— Steve Nison (@nison_steve) June 30, 2021
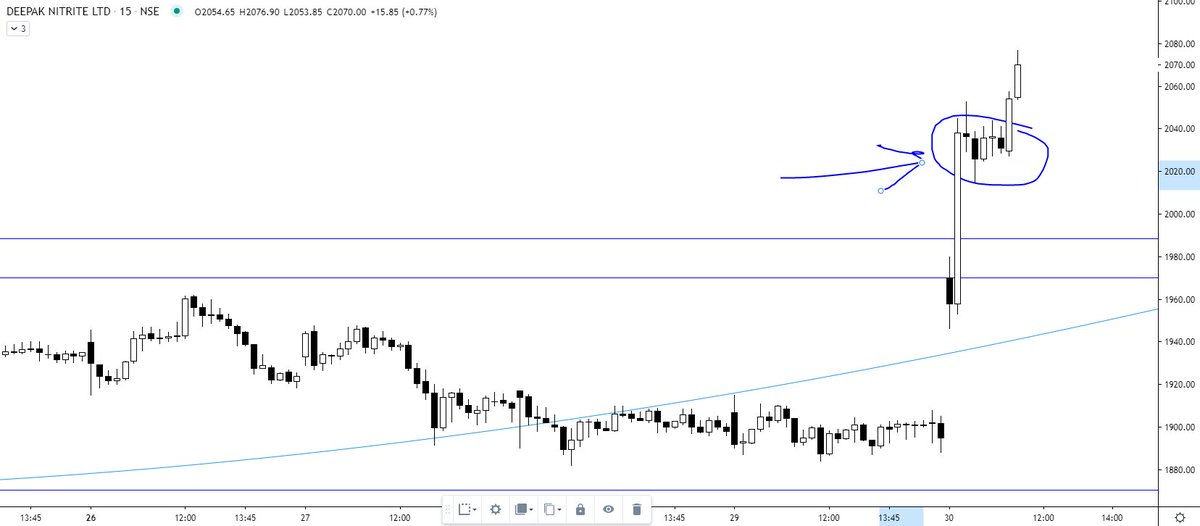
In the last 10 minutes, all the selling was absorbed despite intraday positions being squared off (if not converted). will wait for the EOD data. However, the chart structure is extremely strong. https://t.co/pci7GCDBEO pic.twitter.com/1NBD9V3mKc
A bullish flag pattern right after the breakout. Although the broader rectangle target of 1190 is way more than this bullish flag target https://t.co/wdAzb7SS7L
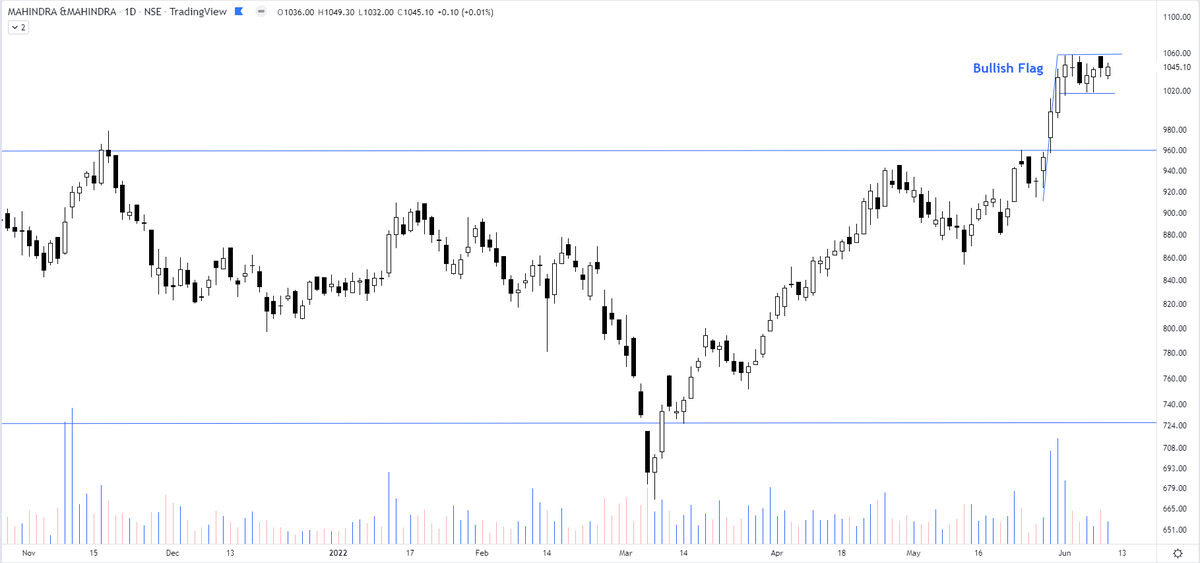
Interesting chart of Mahindra & Mahindra consolidating in a rectangle pattern & the price not falling back to the lower support. pic.twitter.com/GJ7rCfkB9f
— The_Chartist \U0001f4c8 (@charts_zone) May 26, 2022
More from Screeners


Positive signs on inflation include fertilizer prices peaking and trending downward. Used Car prices are also down (which led inflation). The recent price break on the $XLE - which emerged almost to the day the market topped, could be an indication that we are close to a low. pic.twitter.com/2MtcKjjmAz
— Mark Minervini (@markminervini) June 23, 2022
You May Also Like


One thing I've been noticing about responses to today's column is that many people still don't get how strong the forces behind regional divergence are, and how hard to reverse 1/ https://t.co/Ft2aH1NcQt
— Paul Krugman (@paulkrugman) November 20, 2018
See this thing that @lymanstoneky wrote:
And see this thing that I wrote:
And see this book that @JamesFallows wrote:
And see this other thing that I wrote: