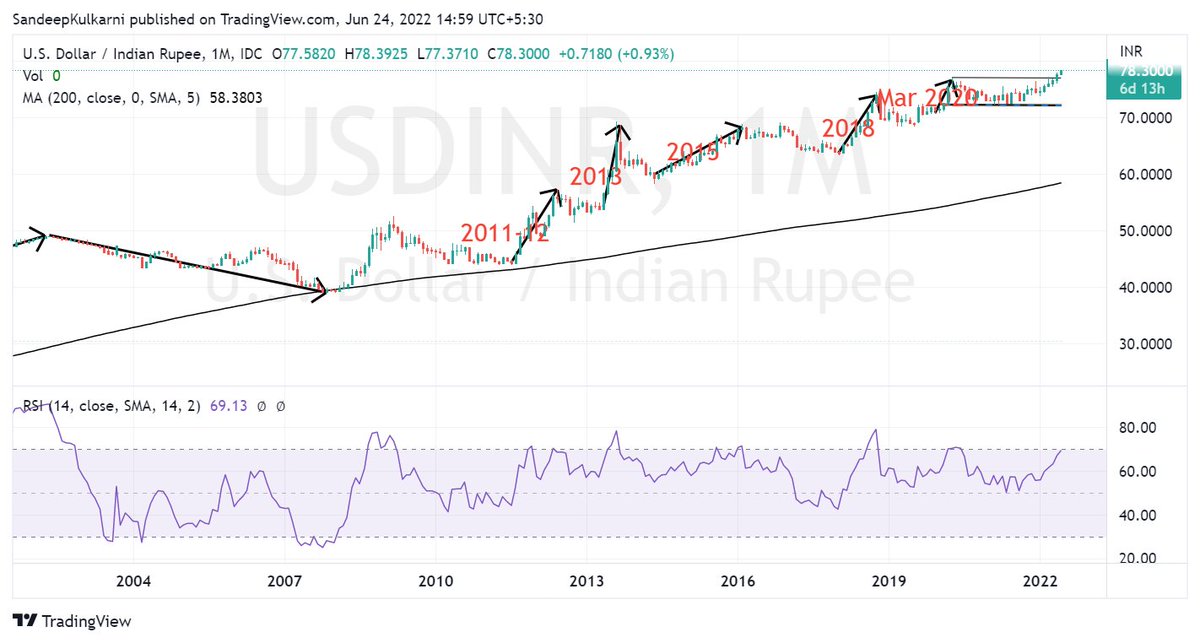
History tells us when #USDINR moves it moves a lot. In that context it has been remarkably resilient with just 8% depreciation. It looks like we are very close to the point from where Rupee will start to appreciating again.
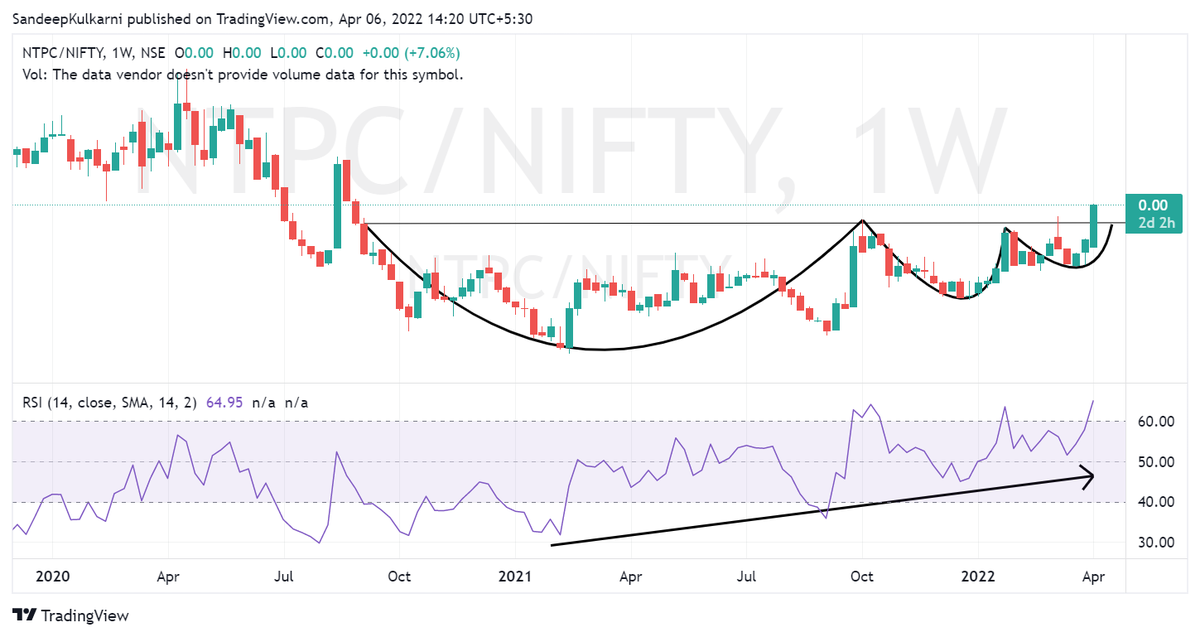
BTW Nifty Metal has inverse correlation with USDINR. https://t.co/X6cqVcYF3V
We know how our stock market has weathered the FII selling.
— Sandeep Kulkarni (@moneyworks4u_fa) June 10, 2022
But the equally big story is how Rupee has weathered $50bn+ outflows since Oct 2021. Hats off to RBI Governor Das & his team for having the vision of building huge reserves in his tenure. pic.twitter.com/CVuF9dM361
More from Sandeep Kulkarni
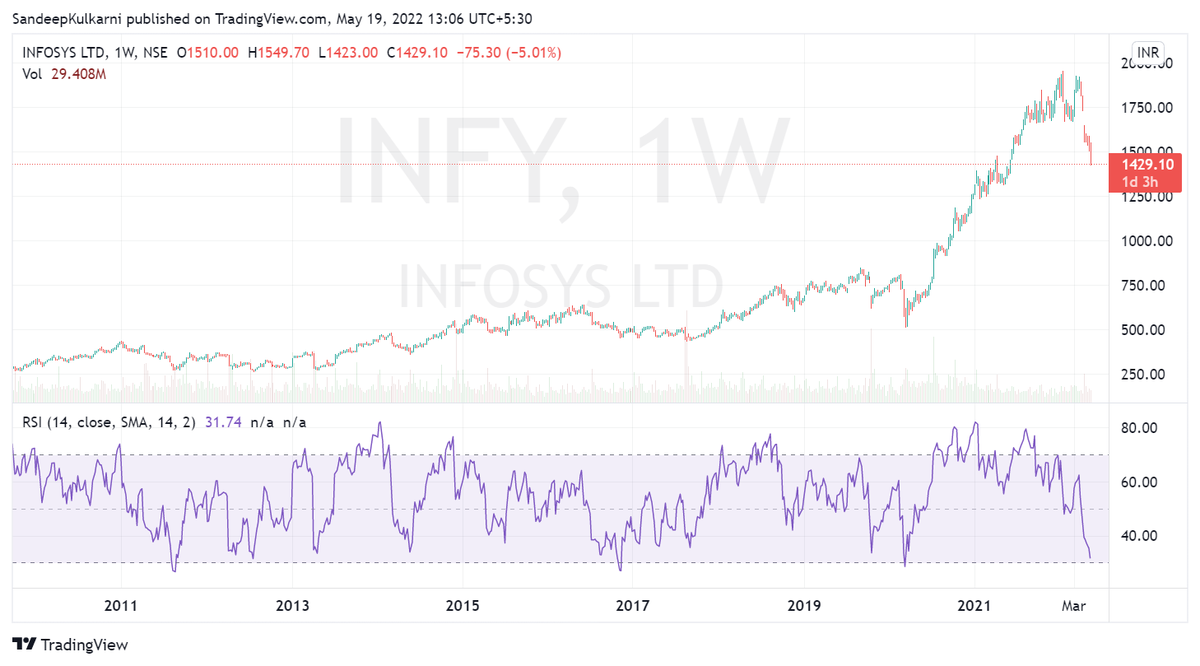
Infosys PEG ratio (1-year fwd PE/EPS growth) down to 1.4x from a peak of 2.7x as PE cut by 27% & EPS growth cut by 5% - trades at 23.3x PE for 11% FY23 growth. If this is a mid-cycle correction, its done BUT if this is the great valuation reset - more fall coming
— ThirdSide (@_ThirdSide_) May 25, 2022
Place your bets pic.twitter.com/9ZlaLDcxPZ
This is Nifty's chart from 2004 to 2006. Back then also US interest rates had gone up. Markets had corrected well before Fed had hiked rates for first time in 2004, from then it hiked rates 17 times by 4.25% over next 2 yrs and yet market kept making new highs. @shivaji_1983 pic.twitter.com/EAFhske9EE
— Sandeep Kulkarni (@moneyworks4u_fa) February 11, 2022
More from Screeners
Do Share the above tweet 👆
These are going to be very simple yet effective pure price action based scanners, no fancy indicators nothing - hope you liked it.
https://t.co/JU0MJIbpRV
52 Week High
One of the classic scanners very you will get strong stocks to Bet on.
https://t.co/V69th0jwBr
Hourly Breakout
This scanner will give you short term bet breakouts like hourly or 2Hr breakout
Volume shocker
Volume spurt in a stock with massive X times
Do read it completely to understand the stance and the plan.
This thread will present a highly probable scenario of markets for the upcoming months. Will update the scenario too if there is a significant change in view in between.
— Aakash Gangwar (@akashgngwr823) May 15, 2022
1/n https://t.co/jfWOyEgZyd
1. The moving average structure - Many traders just look at the 200 ma test or closing above/below it regardless of its slope. Let's look at all the interactions with 200 ma where price met it for the first time after the trend change but with 200 ma slope against it
One can clearly sense that currently it is one of those scenarios only. I understand that I might get trolled for this, but an unbiased mind suggests that odds are highly against the bulls for making fresh investments.
But markets are good at giving surprises. What should be our stance if price kept on rising? Let's understand that through charts. The concept is still the same. Divergent 200 ma and price move results in 200 ma test atleast once which gives good investment opportunities.
2. Zig-Zag bear market- There are two types of fall in a bear market, the first one is vertical fall which usually ends with ending diagonals (falling wedges) and the second one is zig zag one which usually ends with parabolic down moves.