2) Trading View or Kite app
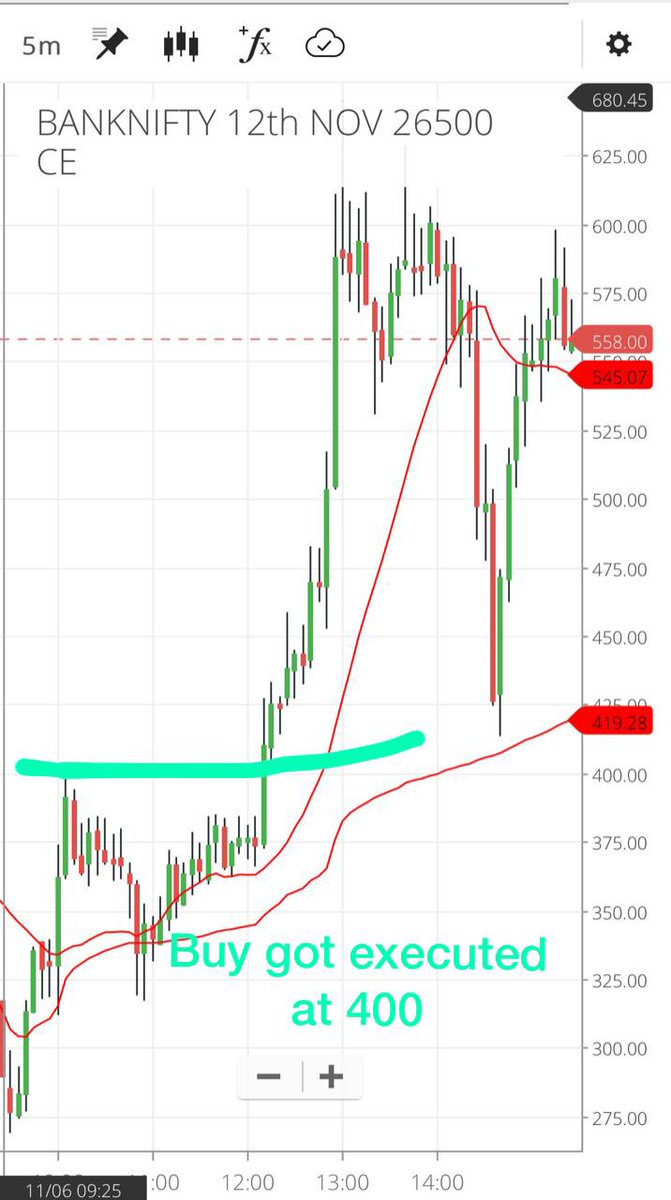
I use trading view for intraday charts.
As I trade intraday, I use the 5 min time frame.
My chart is simple with 20 sma plotted on it along with CPR(central pivot range)
Price > 20 sma & CPR indicates bullish trend for intraday & vice-versa
3) Icharts
As I majorly trade option premiums(short volatility or theta decay strategies)
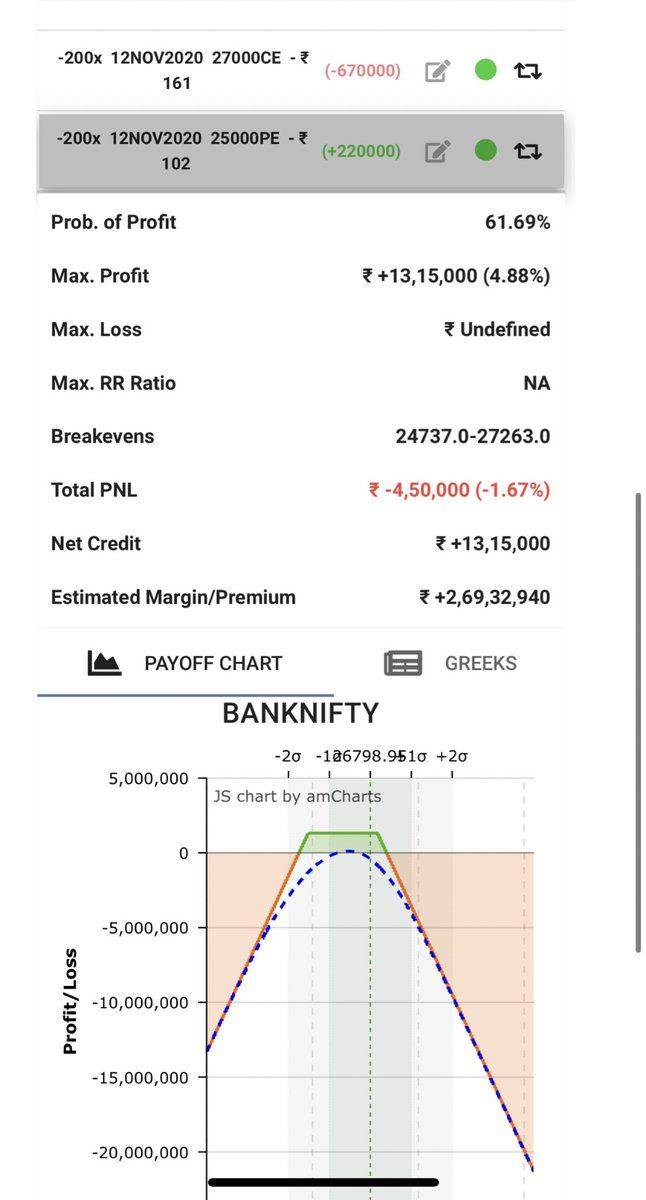
I keep a track of combined premium of strangle using
@iChartsIndia Combined premium should be trending down & below VWAP to create a strangle
4) QuantsApp
As I need to provide analysis on TV channel.
I need to analyse overall market breadth, futures data & option chain activitiy.
@quantsapp provides
Futures Data : Long Builtup/Short Builtup
Options Data : Max Call OI/ Put OI
Market Breadth : For overall sentiment
5) Spider
I used
@SpiderSoftIn to scan momentum stocks for intraday.
Spider helps in identfiying :
stocks hitting 52 week high/ low
Stocks making day high/low
Stocks with large buying single orders
6) Bloomberg
Helps in quick real time news.
Bloomberg is useful only if you trade mutliple markets & need access to various data quickly.
Bloomberg is an expensive software costing around 25 L per year.
One can skip bloomberg as cost is too high
7) GreekSoft
I use Greeksoft for multi leg order execution. It allows you to punch 1000+ lots of strangles/ straddles as a single order.
One can put SL on combined premium, do order slicing & many more such things.
Needed only if you trade big qty multi leg option trades
8) Ranking System (Proprietary)
Use an inhouse ranking system based on simple concepts of momentum,trend & derivatives data across time frames.
It is available only to IIFL members under our franchise(for free). To know more can check below :
https://t.co/wqzN2OtJYL
9) Opstra by
@Definedge Opstra is useful in
-Creating option payoff
- Has historical result calendar with time
-Volatility Skew Analysis
10) Fundamental Data
a)
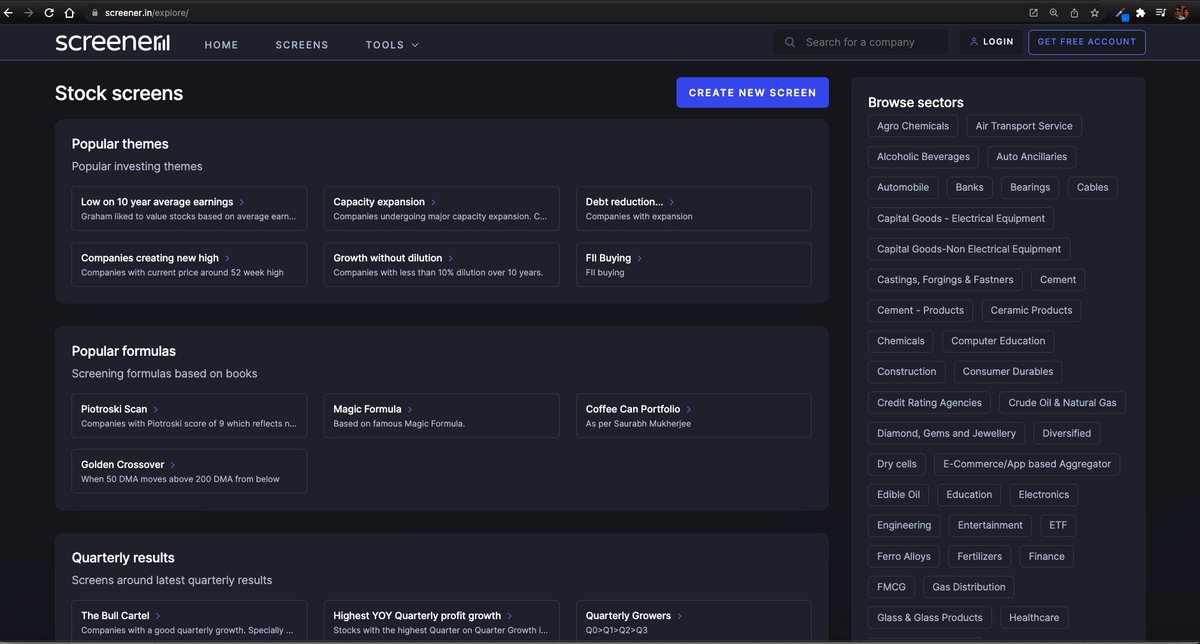
@screener_in Screener is useful in scanning stocks based on Fundamental parameters & also provides a quick overview of the company.
You can quickly find good companies based on fundamental parameters
10 b ) Stock Edge
@mystockedge is useful in
scanning bulk/ block deals
Checking top investor portfolios
Check company filings
IPO notes
Concall analysis
10 c)
https://t.co/B2flmgzmGH @drvijaymalik has built a great framework to analyse company in depth based on various fundamental parameters.
I personally use it to scan fundamental stocks.
11) I hope you found the above thread useful.
Goodluck on your Trading Journey !
End