This is done to:
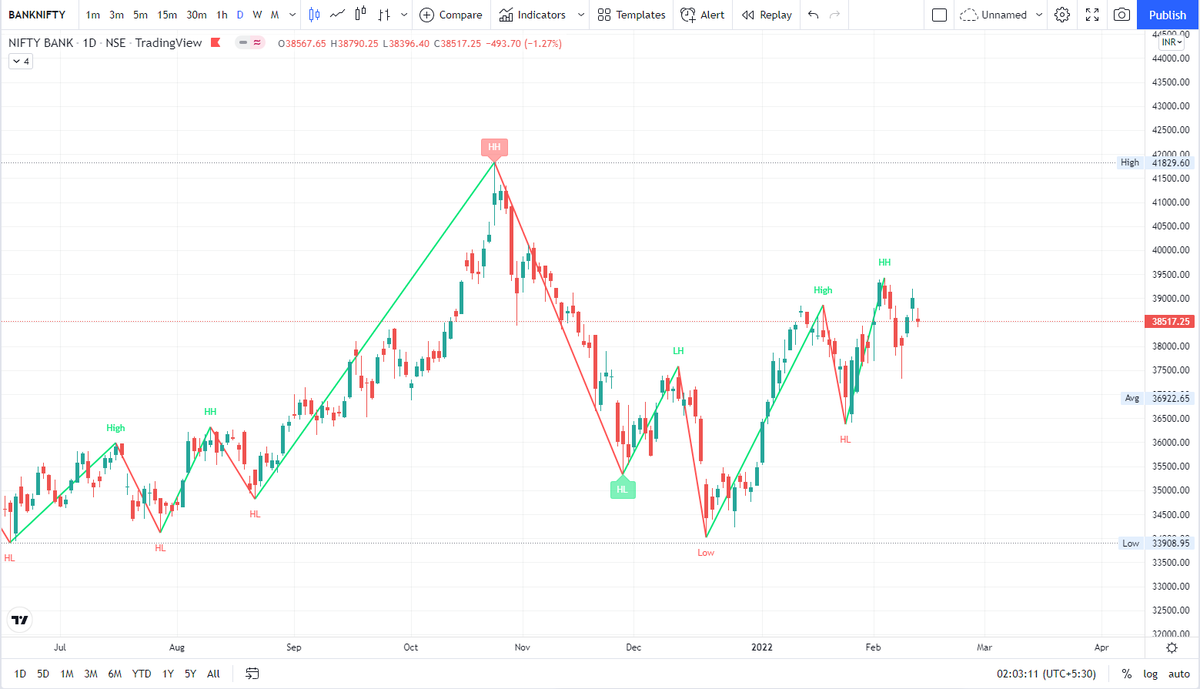
- Find the structure (HH-HL means bullish, LH-LL means bearish)
- Align trades with the trend on the longer timeframe
- Find important Support/Resistance levels
- Trendlines
She does this to find the direction and levels.


I curated a list on 13 examples of Weekly Bank Nifty analysis by @niki_poojary, chronologically: \U0001f9f5
— Aditya Todmal (@AdityaTodmal) February 12, 2022
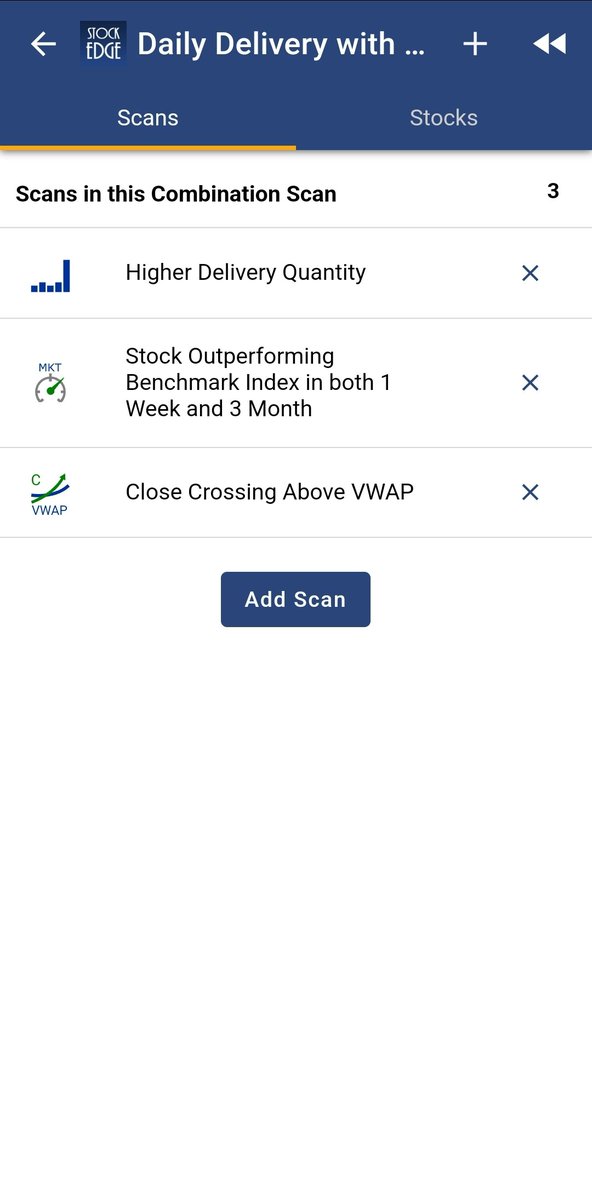
Screeners helps trader in saving lot of time in filtering best stocks out of 5000+ stocks listed.
— Yash Mehta (@YMehta_) October 28, 2022
Here is the list of top 10 Free Candlestick Pattern based screeners that I use:
Also, last two screeners are my favorite to pick early momentum stocks.
Screeners helps trader in saving lot of time in filtering best stocks out of 1000+ stocks listed.
— Yash Mehta (@YMehta_) September 16, 2022
Here is the list of top 9 Free Price Action based screeners that I use:
Also, last screener is my favorite to pick early momentum stocks.
Screeners helps trader in saving lot of time in filtering best stocks out of 5000+ listed stocks.
— Yash Mehta (@YMehta_) December 9, 2022
Here is the list of top 7 Free Strategy and its respective screeners that I use:
Also, last screener is my favorite to pick early momentum stocks.
There are so many investment strategies, still hardly anyone creates long term wealth in stocks.
— Yash Mehta (@YMehta_) November 25, 2022
Sharing 4 Investment Strategies based on Technical Analysis and Screeners for free (sold as a \u20b9 50,000 course!).
Shared a bonus trading strategy at the end.
A thread \U0001f9f5:

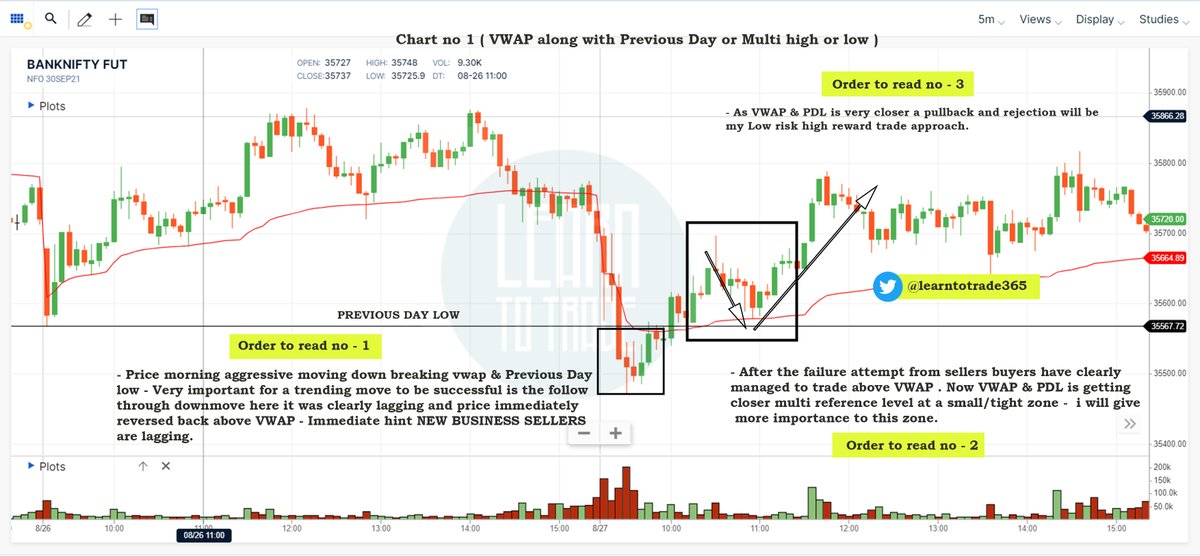
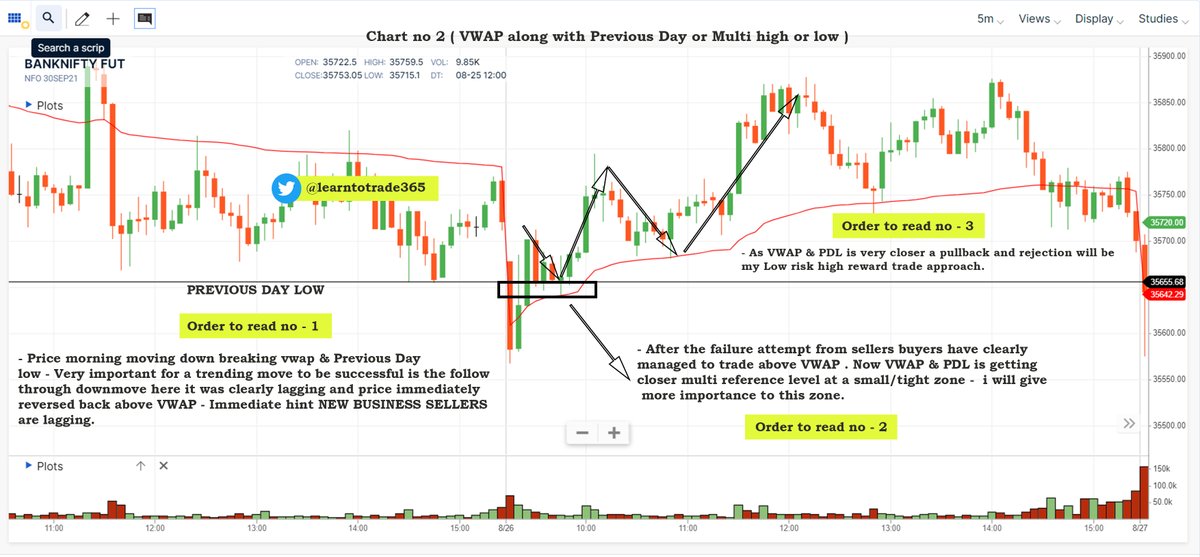
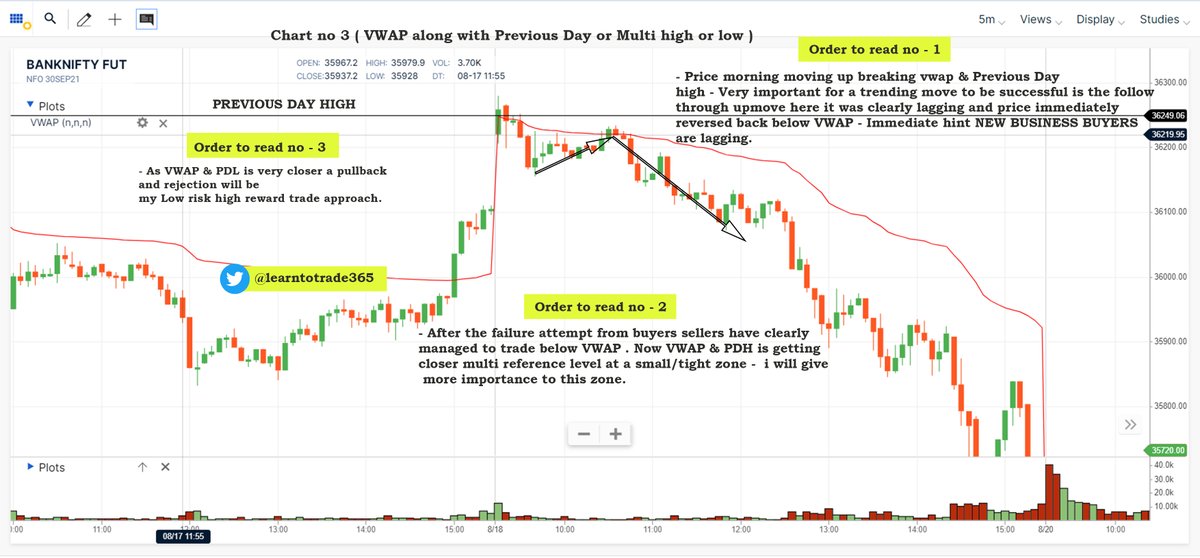
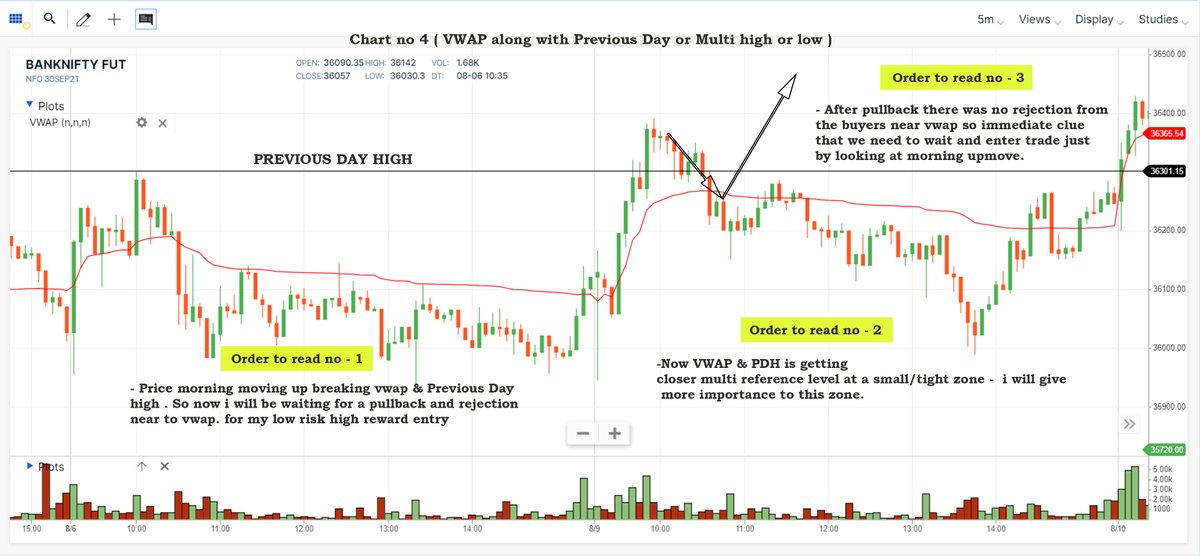
VWAP for intraday Trading Part -1
— Learn to Trade (@learntotrade365) August 28, 2021
A small thread PART -2 will be released tomorrow
Traders show your support by like & retweet to benefit all@Mitesh_Engr @ITRADE191 @ProdigalTrader @nakulvibhor @ArjunB9591 @CAPratik_INDIAN @RajarshitaS @Stockstudy8 @vivbajaj @Prakashplutus pic.twitter.com/y8bwisM4hB
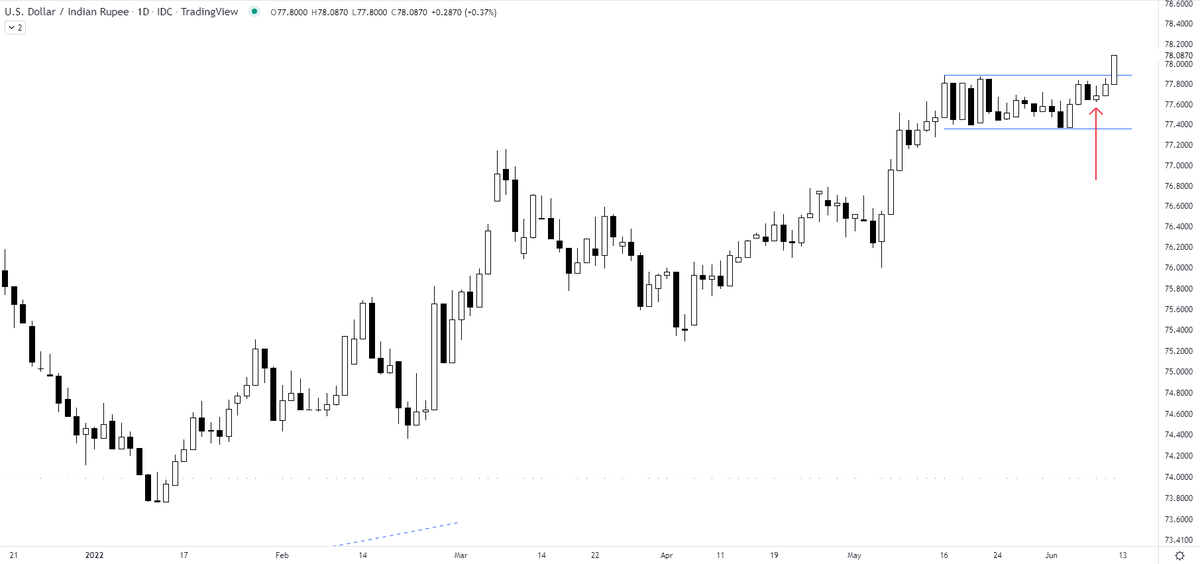
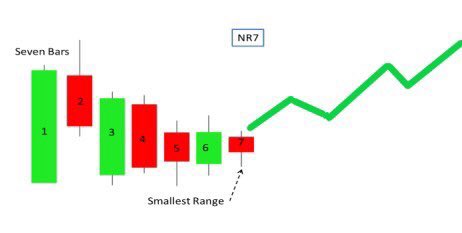
Can you anticipate a breakout? Yes
— The_Chartist \U0001f4c8 (@charts_zone) June 10, 2022
the attached tweet.
now the chart is for USDINR https://t.co/Vb2wKaCvTB pic.twitter.com/INo0GC4fGY
Ironies of Luck https://t.co/5BPWGbAxFi
— Morgan Housel (@morganhousel) March 14, 2018
"Luck is the flip side of risk. They are mirrored cousins, driven by the same thing: You are one person in a 7 billion player game, and the accidental impact of other people\u2019s actions can be more consequential than your own."