Now the question is.. with so many stocks around, how one must filter and check? (2/12)
I have earlier shared some setups/strategies for Intraday. One of them was ORB (opening range breakout) setup.. but I still get DM about this. So here's a thread about how to find ORB stocks: (1/12)
Now the question is.. with so many stocks around, how one must filter and check? (2/12)
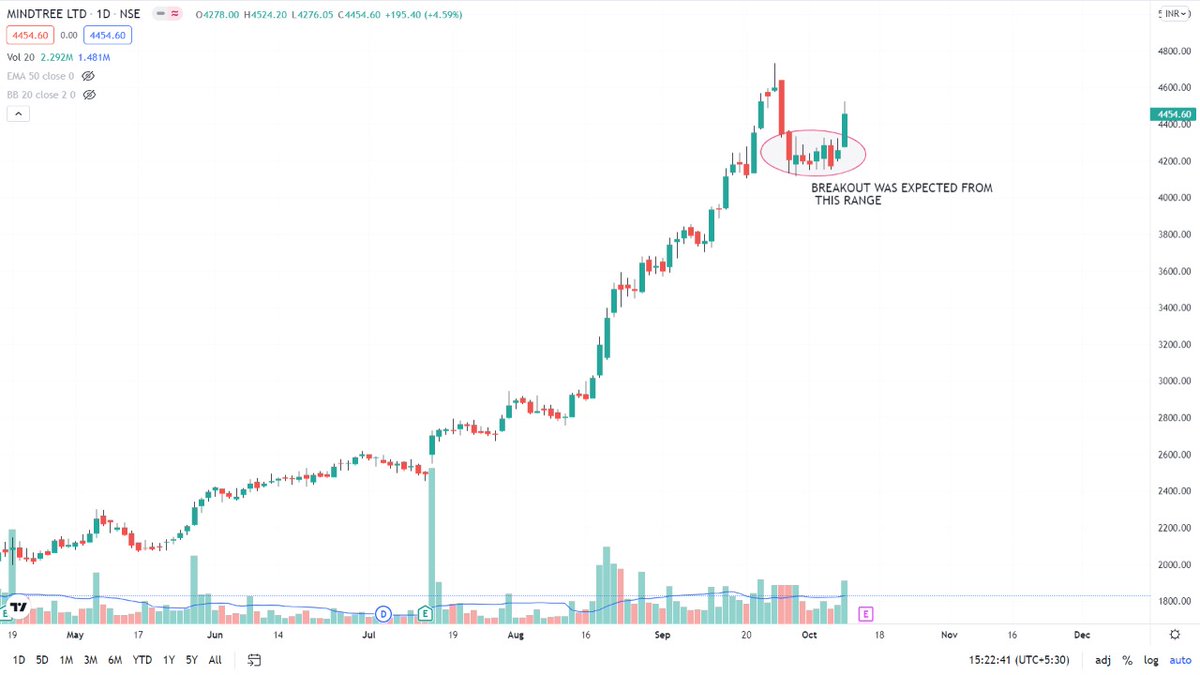
Find the sector or theme with good recent performance and keep its stocks in watchlist. I keep an alert for breakout price when I see a good chart. (3/12)
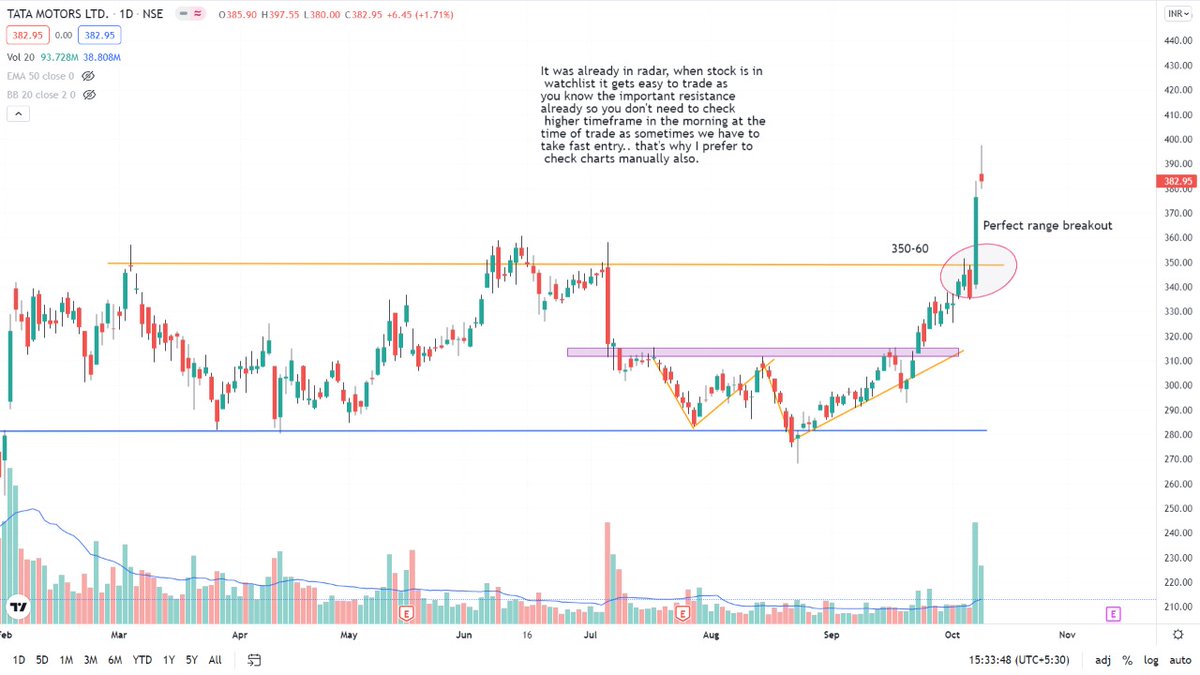
Not every stock gives a move of 7-8%. Look for stock that move 7-8% in one go when they give a breakout (Stocks unlike ITC that moves once in a year). (4/12)
IRCTC, Mindtree, Bajaj Twins, IEX, TataElxsi, Naukri, Coforge are some great examples. Rest you can observe and add.
Recent examples 👇(5/12)
Observation is the key in trading. I don't use any screener but I don't research for hours either. I observe and keep my mind open. (7/12)
I developed these strategies based on my experiences. You can develop your own too. (8/12)
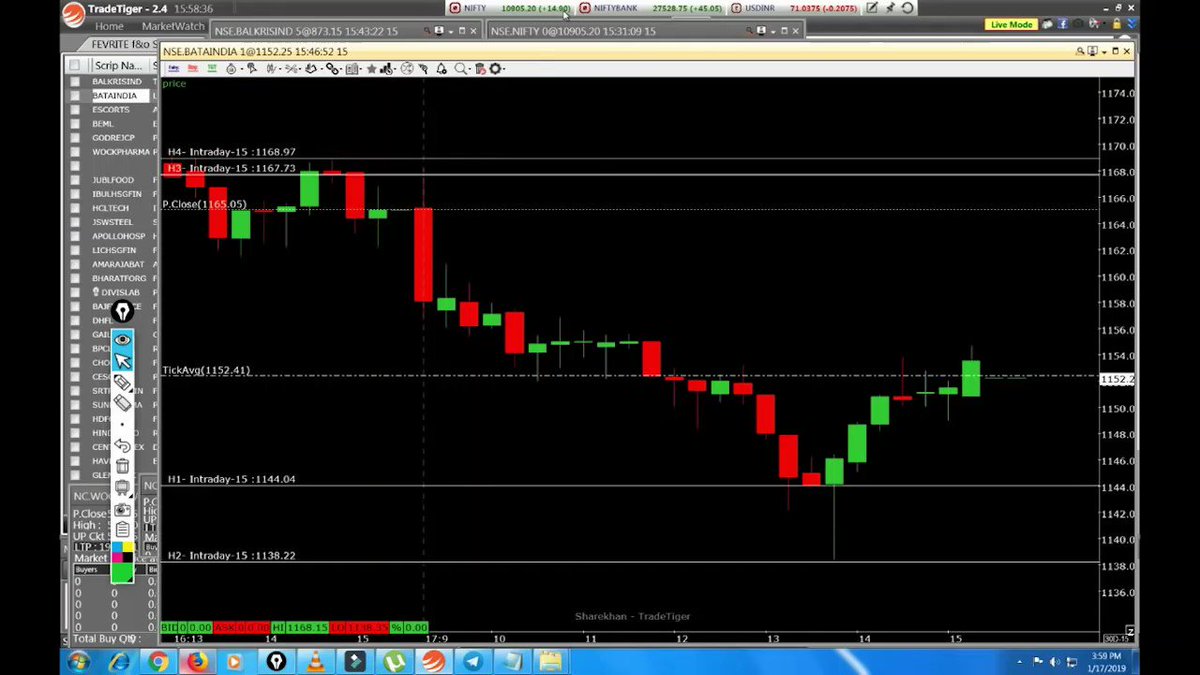
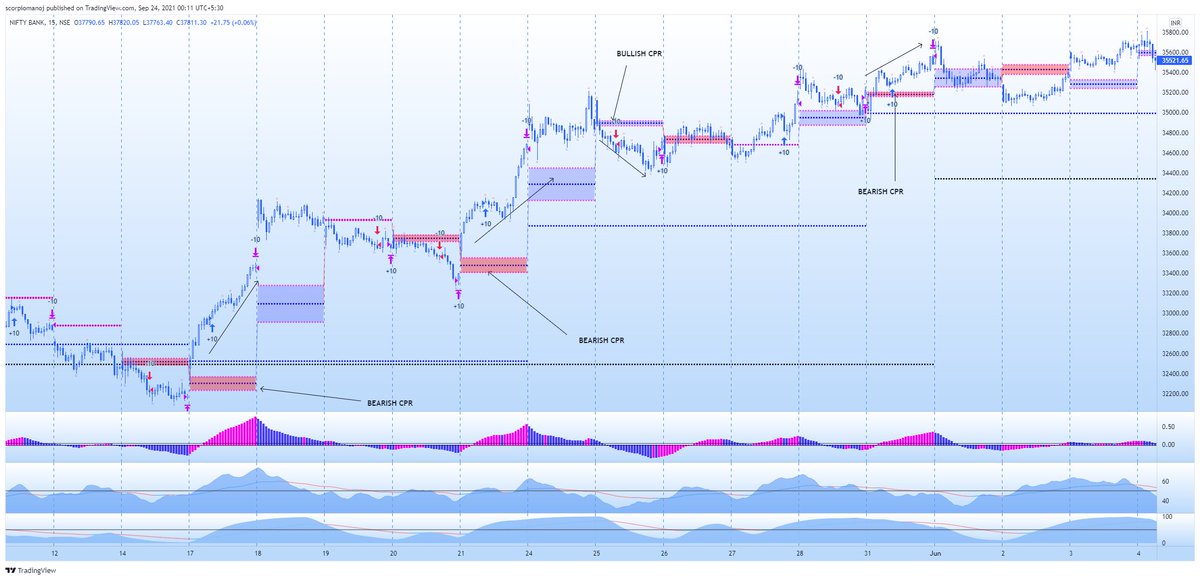
I observe the stock between 9:15 to 9:25 to check if it's giving any bullish candles. If I see the first 2 good bullish candles with volumes. (9/12)
Recent example of Aarti industry for more understanding. 👇(11/12)
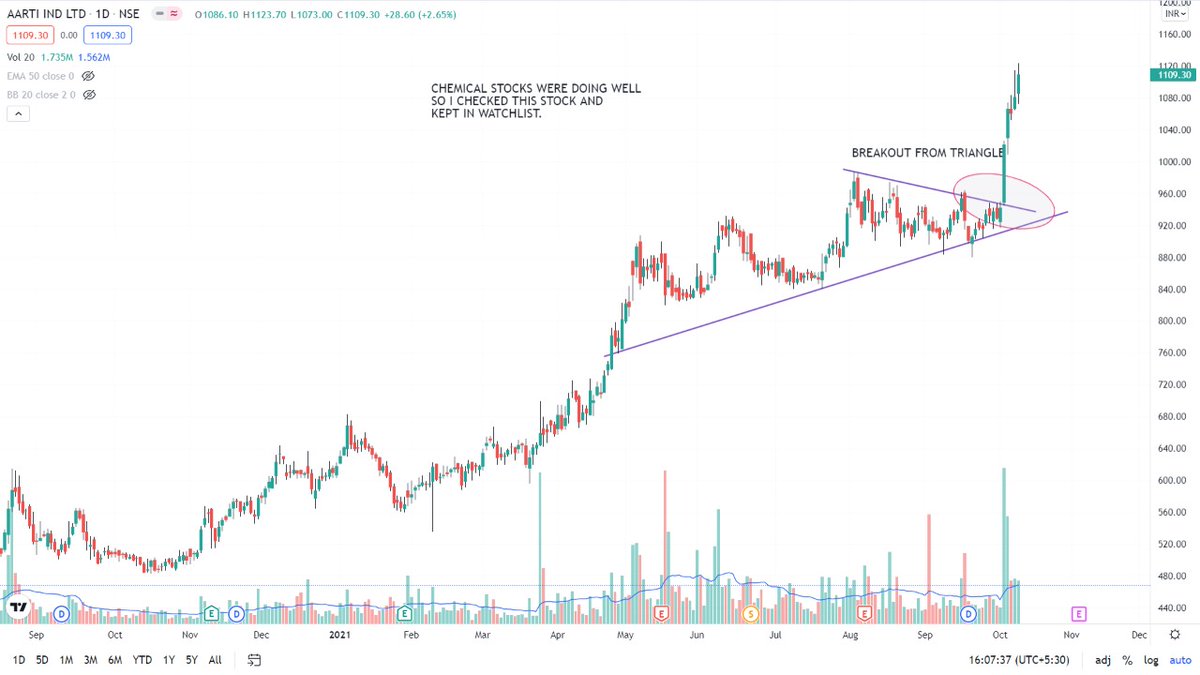
https://t.co/VfTRAokAXw
https://t.co/6LIa458yJY all BO stock today pic.twitter.com/4K44i0k8ib
— itrade(DJ) (@ITRADE191) August 18, 2021
More from Sheetal Rijhwani
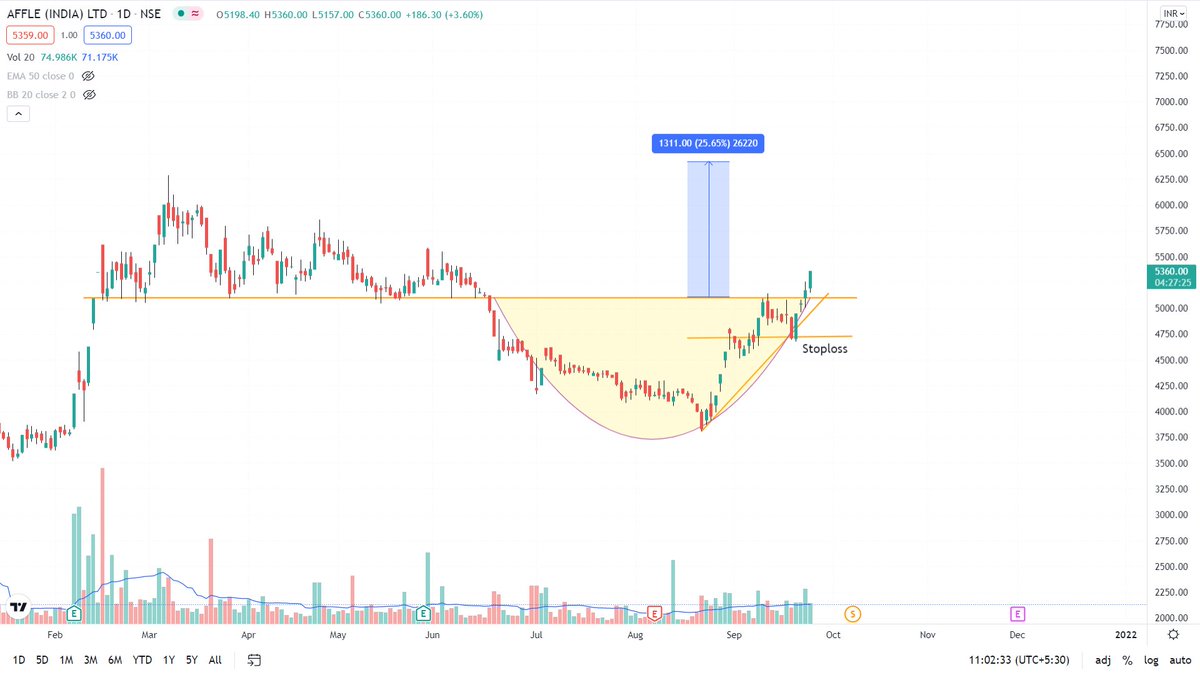
#AffleIndia updated chart
Target - 6400+
Stop loss - 4650 https://t.co/DD6pFtSvMI
Target - 6400+
Stop loss - 4650 https://t.co/DD6pFtSvMI
#AffleIndia
— Sheetal Rijhwani (@RijhwaniSheetal) August 8, 2021
It's at retest of weekly breakout level.. we can get a good entry with favourable risk/reward. Have a look at chart! #stockmarket #stockstowatch pic.twitter.com/cS9EOIoWJl
If you're a swing/positional/trend follower, then this thread is for you. In this one, I will be covering how to filter stocks, how to take entry and the exit plans. 🧵 (1/21)
It's practically impossible to check all charts. However, you can use multiple scanners as per your setups to make things easy.
In trending market, even junk stocks give a good move. But in sideways and falling markets, you have to be very selective. (2/21)
One imp. filter for me is trading in strong fundamental stocks. Every quarter, I check results of companies and filter the list. I keep checking the charts and set an alert on the levels. Many good handles on Twitter post good results lists, you can save that as well. (3/21)
This time, I did the same on my telegram channel.
https://t.co/C3eS9PSncG
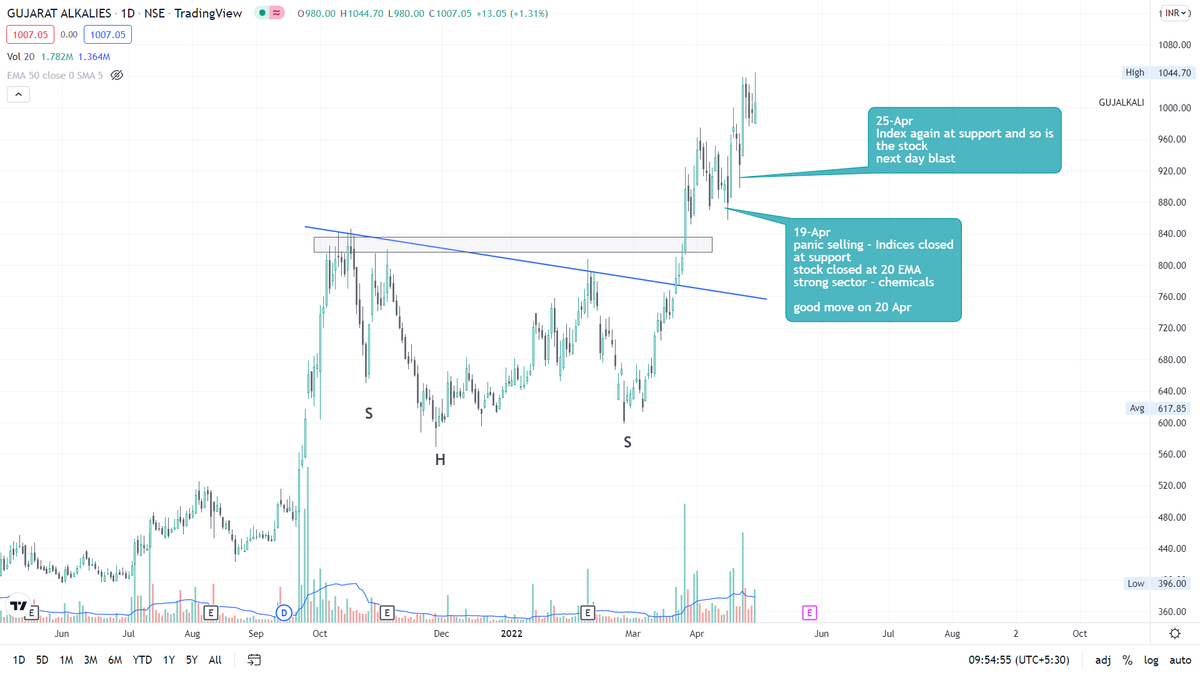
Second filter for me is Current Performing Sectors/Themes. Keep your eyes and ears open. Being a good observer helps you big time. Make good use of news in your analysis. (4/21)
For Eg: Textiles are performing well for a while now. It has strong consumer interest due to many global retailers, diversifying their outsourcing and reducing their dependence on China. Order booking from India has increased rapidly. (5/21)
It's practically impossible to check all charts. However, you can use multiple scanners as per your setups to make things easy.
In trending market, even junk stocks give a good move. But in sideways and falling markets, you have to be very selective. (2/21)
One imp. filter for me is trading in strong fundamental stocks. Every quarter, I check results of companies and filter the list. I keep checking the charts and set an alert on the levels. Many good handles on Twitter post good results lists, you can save that as well. (3/21)
This time, I did the same on my telegram channel.
https://t.co/C3eS9PSncG
Second filter for me is Current Performing Sectors/Themes. Keep your eyes and ears open. Being a good observer helps you big time. Make good use of news in your analysis. (4/21)
For Eg: Textiles are performing well for a while now. It has strong consumer interest due to many global retailers, diversifying their outsourcing and reducing their dependence on China. Order booking from India has increased rapidly. (5/21)
More from Screeners


TradingView isn't just charts
It's much more powerful than you think
9 things TradingView can do, you'll wish you knew yesterday: 🧵
Collaborated with @niki_poojary
1/ Free Multi Timeframe Analysis
Step 1. Download Vivaldi Browser
Step 2. Login to trading view
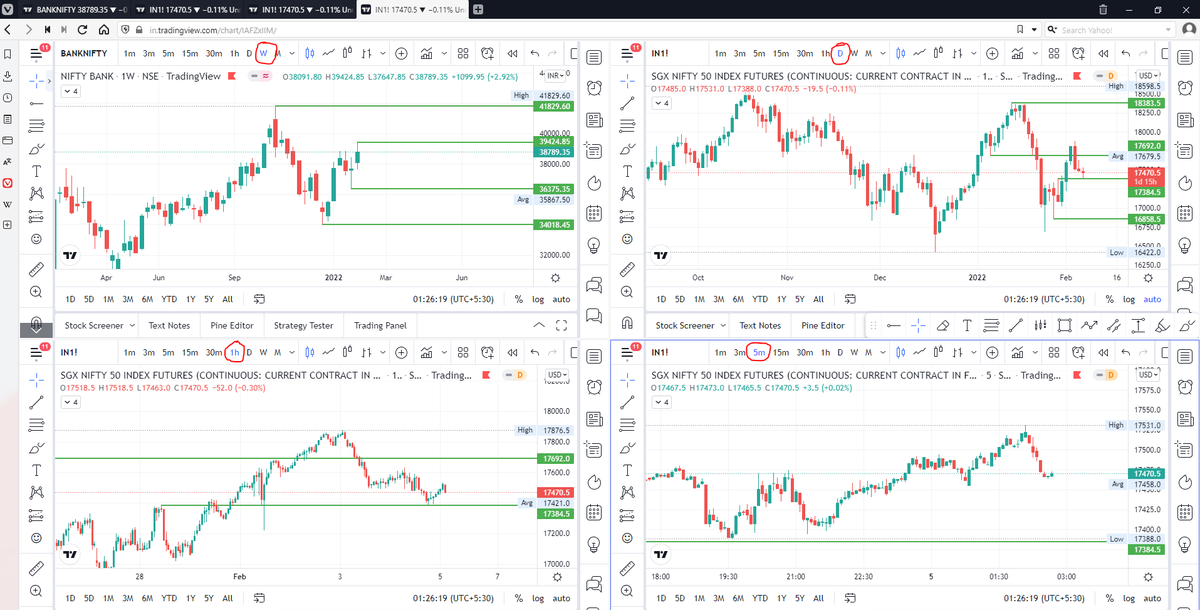
Step 3. Open bank nifty chart in 4 separate windows
Step 4. Click on the first tab and shift + click by mouse on the last tab.
Step 5. Select "Tile all 4 tabs"
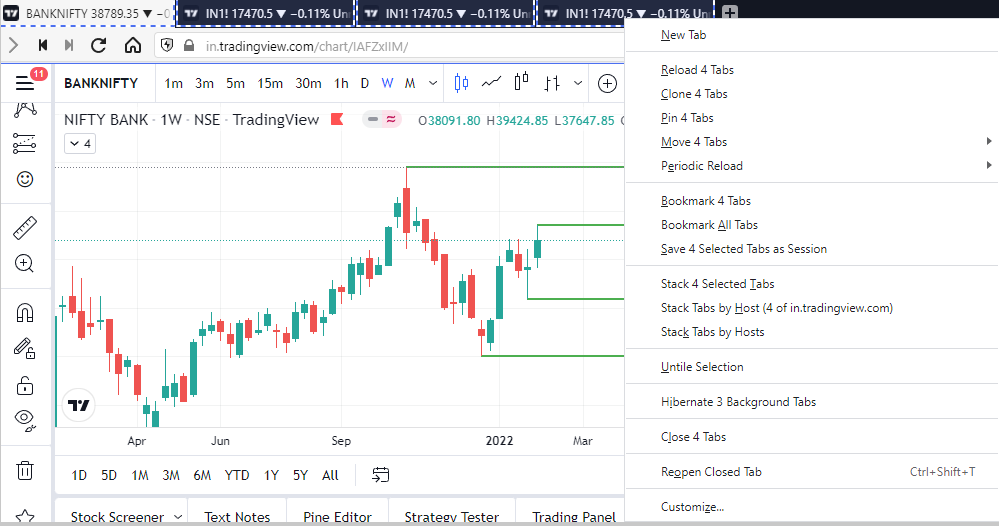
What happens is you get 4 charts joint on one screen.
Refer to the attached picture.
The best part about this is this is absolutely free to do.
Also, do note:
I do not have the paid version of trading view.
2/ Free Multiple Watchlists
Go through this informative thread where @sarosijghosh teaches you how to create multiple free watchlists in the free
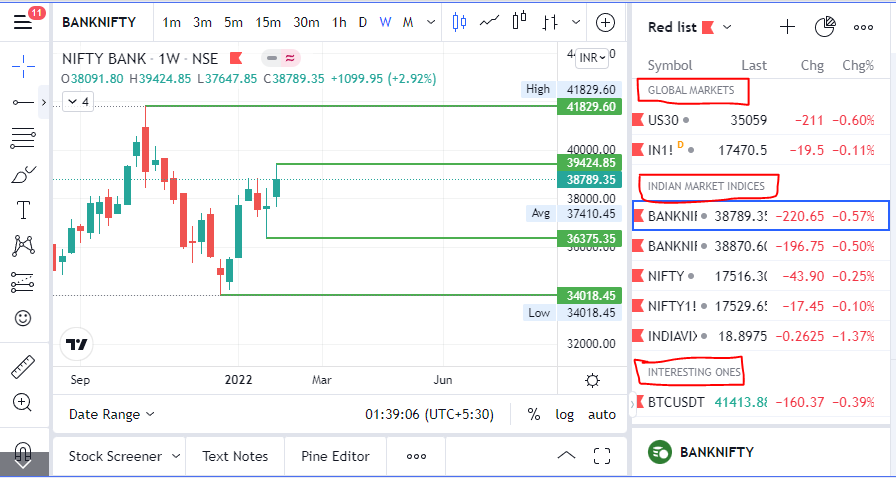
3/ Free Segregation into different headers/sectors
You can create multiple sections sector-wise for free.
1. Long tap on any index/stock and click on "Add section above."
2. Secgregate the stocks/indices based on where they belong.
Kinda like how I did in the picture below.
It's much more powerful than you think
9 things TradingView can do, you'll wish you knew yesterday: 🧵
Collaborated with @niki_poojary
1/ Free Multi Timeframe Analysis
Step 1. Download Vivaldi Browser
Step 2. Login to trading view
Step 3. Open bank nifty chart in 4 separate windows
Step 4. Click on the first tab and shift + click by mouse on the last tab.
Step 5. Select "Tile all 4 tabs"
What happens is you get 4 charts joint on one screen.
Refer to the attached picture.
The best part about this is this is absolutely free to do.
Also, do note:
I do not have the paid version of trading view.
2/ Free Multiple Watchlists
Go through this informative thread where @sarosijghosh teaches you how to create multiple free watchlists in the free
\U0001d5e0\U0001d602\U0001d5f9\U0001d601\U0001d5f6\U0001d5fd\U0001d5f9\U0001d5f2 \U0001d600\U0001d5f2\U0001d5f0\U0001d601\U0001d5fc\U0001d5ff \U0001d604\U0001d5ee\U0001d601\U0001d5f0\U0001d5f5\U0001d5f9\U0001d5f6\U0001d600\U0001d601 \U0001d5fc\U0001d5fb \U0001d5e7\U0001d5ff\U0001d5ee\U0001d5f1\U0001d5f6\U0001d5fb\U0001d5f4\U0001d603\U0001d5f6\U0001d5f2\U0001d604 \U0001d602\U0001d600\U0001d5f6\U0001d5fb\U0001d5f4 \U0001d601\U0001d5f5\U0001d5f2 \U0001d5d9\U0001d5e5\U0001d5d8\U0001d5d8 \U0001d603\U0001d5f2\U0001d5ff\U0001d600\U0001d5f6\U0001d5fc\U0001d5fb!
— Sarosij Ghosh (@sarosijghosh) September 18, 2021
A THREAD \U0001f9f5
Please Like and Re-Tweet. It took a lot of effort to put this together. #StockMarket #TradingView #trading #watchlist #Nifty500 #stockstowatch
3/ Free Segregation into different headers/sectors
You can create multiple sections sector-wise for free.
1. Long tap on any index/stock and click on "Add section above."
2. Secgregate the stocks/indices based on where they belong.
Kinda like how I did in the picture below.


Time for a new thread on the possibilities I am looking for.
Do read it completely to understand the stance and the plan.
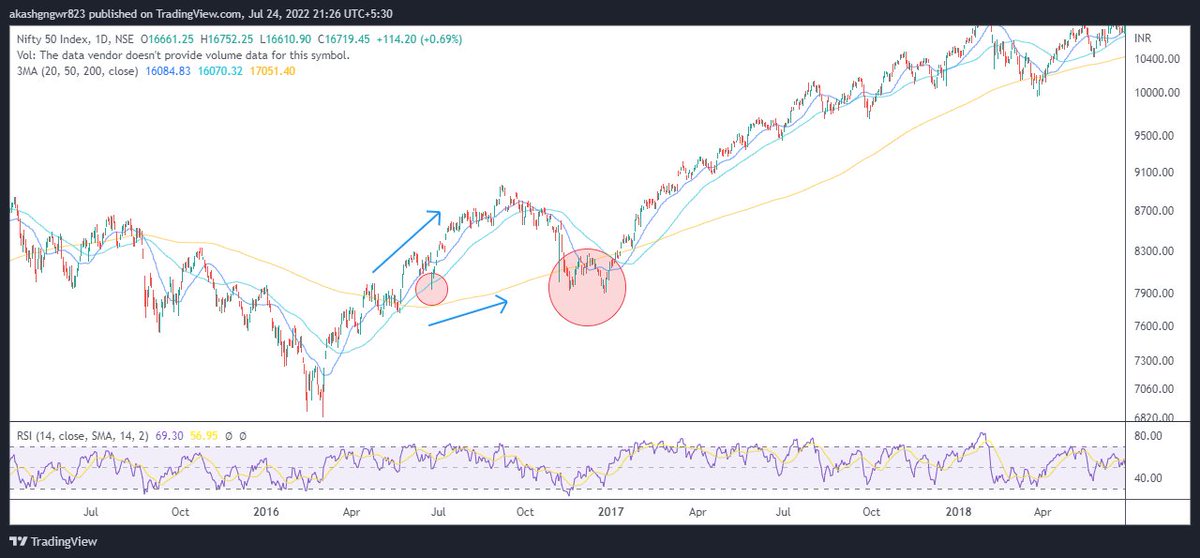
1. The moving average structure - Many traders just look at the 200 ma test or closing above/below it regardless of its slope. Let's look at all the interactions with 200 ma where price met it for the first time after the trend change but with 200 ma slope against it
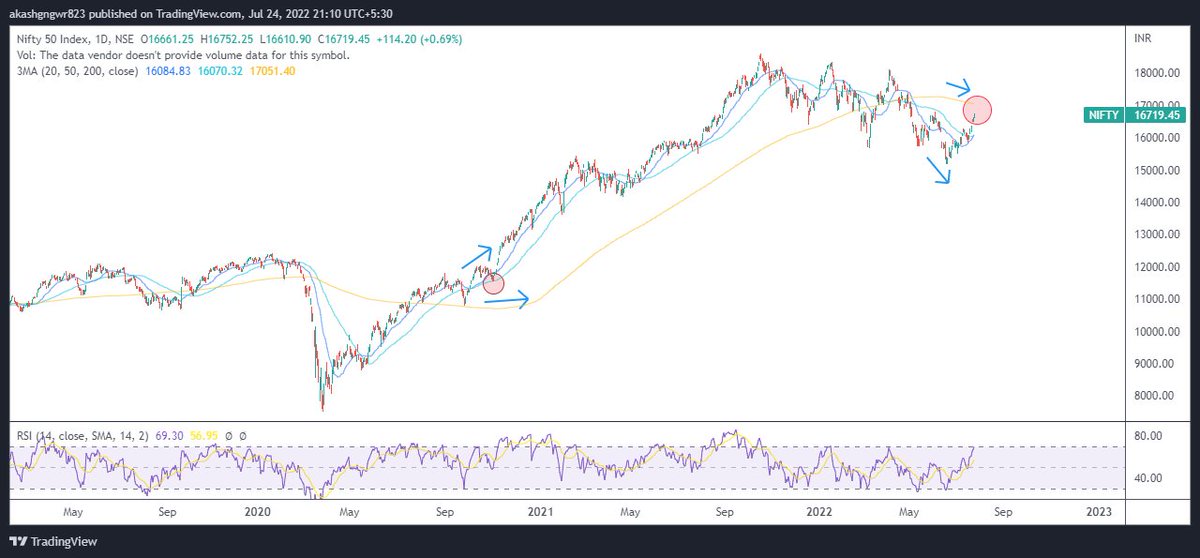
One can clearly sense that currently it is one of those scenarios only. I understand that I might get trolled for this, but an unbiased mind suggests that odds are highly against the bulls for making fresh investments.
But markets are good at giving surprises. What should be our stance if price kept on rising? Let's understand that through charts. The concept is still the same. Divergent 200 ma and price move results in 200 ma test atleast once which gives good investment opportunities.
2. Zig-Zag bear market- There are two types of fall in a bear market, the first one is vertical fall which usually ends with ending diagonals (falling wedges) and the second one is zig zag one which usually ends with parabolic down moves.
Do read it completely to understand the stance and the plan.
This thread will present a highly probable scenario of markets for the upcoming months. Will update the scenario too if there is a significant change in view in between.
— Aakash Gangwar (@akashgngwr823) May 15, 2022
1/n https://t.co/jfWOyEgZyd
1. The moving average structure - Many traders just look at the 200 ma test or closing above/below it regardless of its slope. Let's look at all the interactions with 200 ma where price met it for the first time after the trend change but with 200 ma slope against it
One can clearly sense that currently it is one of those scenarios only. I understand that I might get trolled for this, but an unbiased mind suggests that odds are highly against the bulls for making fresh investments.
But markets are good at giving surprises. What should be our stance if price kept on rising? Let's understand that through charts. The concept is still the same. Divergent 200 ma and price move results in 200 ma test atleast once which gives good investment opportunities.
2. Zig-Zag bear market- There are two types of fall in a bear market, the first one is vertical fall which usually ends with ending diagonals (falling wedges) and the second one is zig zag one which usually ends with parabolic down moves.