Trendlyne has all the research reports available for free for most stocks.
@Trendlyne
Here are all for Laurus
More from Tar ⚡




Open Question to fellow investors tracking Music Industry.
A business like Universal which controls more than 1/3rd of all published music globally is selling for less than 6x FY20 Sales.
Why are Indian businesses like Saregama / Tips selling for 11x, 20x their sales?
If I include all of the revenue generated by entire firm, its selling for ~4.5x FY20 Sales
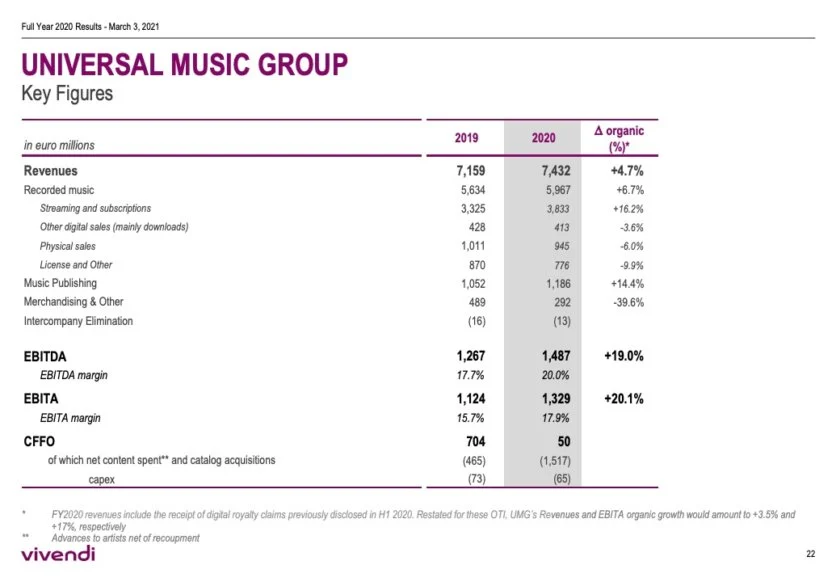
Universal Listing Market Cap ~ 40 Billion USD
FY 20 Revenues ~ 8.87 B USD or 7.4B EUR
Catalogue of Music includes every international artist you can possibly name
Either Universal is grossly undervalued or Saregama/Tips are grossly overvalued.
https://t.co/aHzWSYtcUt
https://t.co/v0EMoCuYKX
A business like Universal which controls more than 1/3rd of all published music globally is selling for less than 6x FY20 Sales.
Why are Indian businesses like Saregama / Tips selling for 11x, 20x their sales?
If I include all of the revenue generated by entire firm, its selling for ~4.5x FY20 Sales
Universal Listing Market Cap ~ 40 Billion USD
FY 20 Revenues ~ 8.87 B USD or 7.4B EUR
Catalogue of Music includes every international artist you can possibly name
Either Universal is grossly undervalued or Saregama/Tips are grossly overvalued.
https://t.co/aHzWSYtcUt
Homework for all the interested participants here:
— Intrinsic Compounding (@soicfinance) June 27, 2021
Q1.Why 20% and not 50%+ Margins for UMG
Q2. Differences in dynamics between Western&Indian cos?
Q3. Trends in West vs Trends in India in the industry.
Research and find the answers. My job is done \U0001f601\U0001f64f
https://t.co/v0EMoCuYKX
If you see the ebitda of universal music its low 20% compared to our saregama 30% or tips 50%. So when you compare earnings saregama is 40x and tips is 30x and universal music is 30x. Also these type of companies are less( low or no capex with excellent and growinh cashflows)
— Srikanth V (@mynameisnani75) June 27, 2021
Guess the Sector, that this company operates in.
ROCE 1 Yr: 32.7%
ROCE 3 Yr: 24.8%
ROE: 27.4%
ROE 3 Yr: 19%
Op Margin: 28.4%
Reserves: 32% of Current Market Cap
Debt: Nil
Profit CAGR 3Yrs: 54%
Debtor Days: 15
Inventory Turnover > 5
CFO YoY Increase : 160%
Some of you got it correct. Its Anjali Portland.
The company just acquired another cement company that will double the total sales immediately.
https://t.co/2xVnpJapPy
The acquisition was financed by adding debt, so interest costs from next quarter will go up but still great!
For a company that operates in a cyclical sector like cement!
What I liked is that the company was able to maintain the balance sheet and margins even in a down cycle.
With real estate sector reviving, this can be a great bet from here.
No recommendations, just an observation.
Market started re-rating the stock as soon as they announced acquisition.
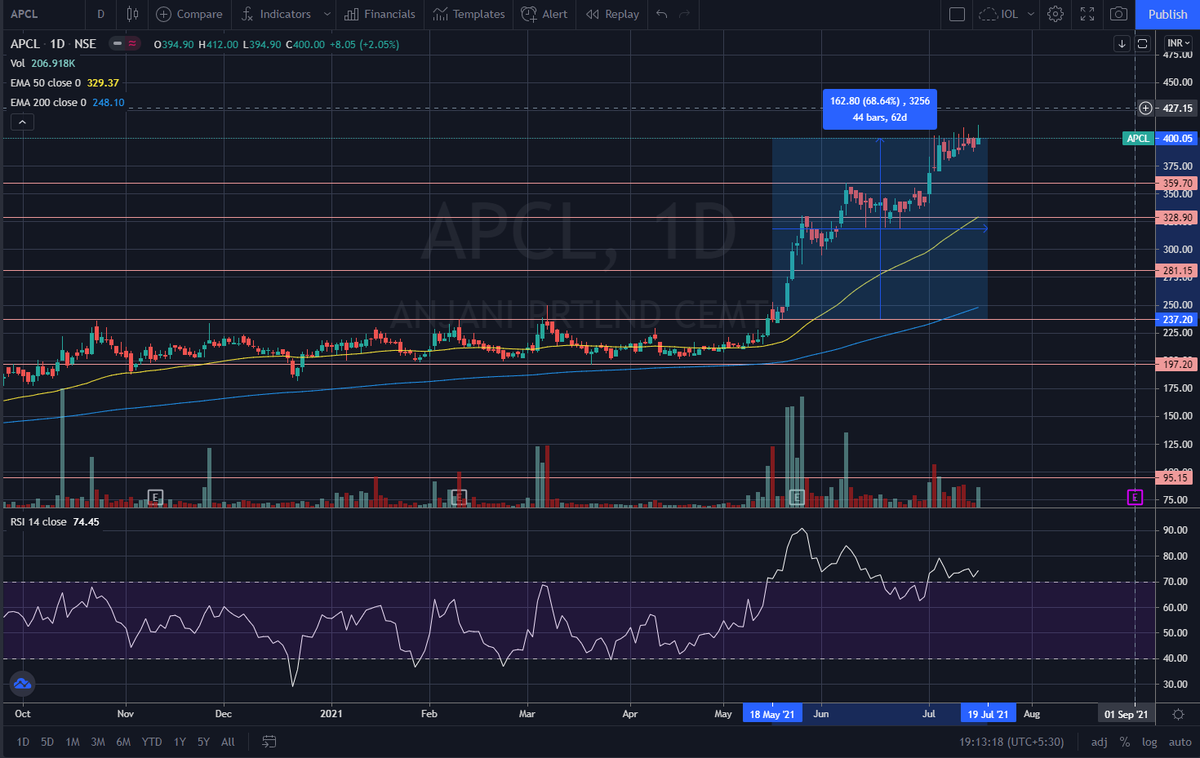
Someone did some work on details of acquisition, sharing the thread
ROCE 1 Yr: 32.7%
ROCE 3 Yr: 24.8%
ROE: 27.4%
ROE 3 Yr: 19%
Op Margin: 28.4%
Reserves: 32% of Current Market Cap
Debt: Nil
Profit CAGR 3Yrs: 54%
Debtor Days: 15
Inventory Turnover > 5
CFO YoY Increase : 160%
Some of you got it correct. Its Anjali Portland.
The company just acquired another cement company that will double the total sales immediately.
https://t.co/2xVnpJapPy
The acquisition was financed by adding debt, so interest costs from next quarter will go up but still great!
For a company that operates in a cyclical sector like cement!
What I liked is that the company was able to maintain the balance sheet and margins even in a down cycle.
With real estate sector reviving, this can be a great bet from here.
No recommendations, just an observation.
Market started re-rating the stock as soon as they announced acquisition.
Someone did some work on details of acquisition, sharing the thread
@drprashantmish6 @Investor_Mohit
— Arun Choudhary FCA (@YOUNGBRUJ) July 9, 2021
1) Information on cement sector in India
India at 550 MTPA is the 2nd largest cement producer globally. Expected to move to 650 MTPA by 2025E pic.twitter.com/GqtcSk03TU