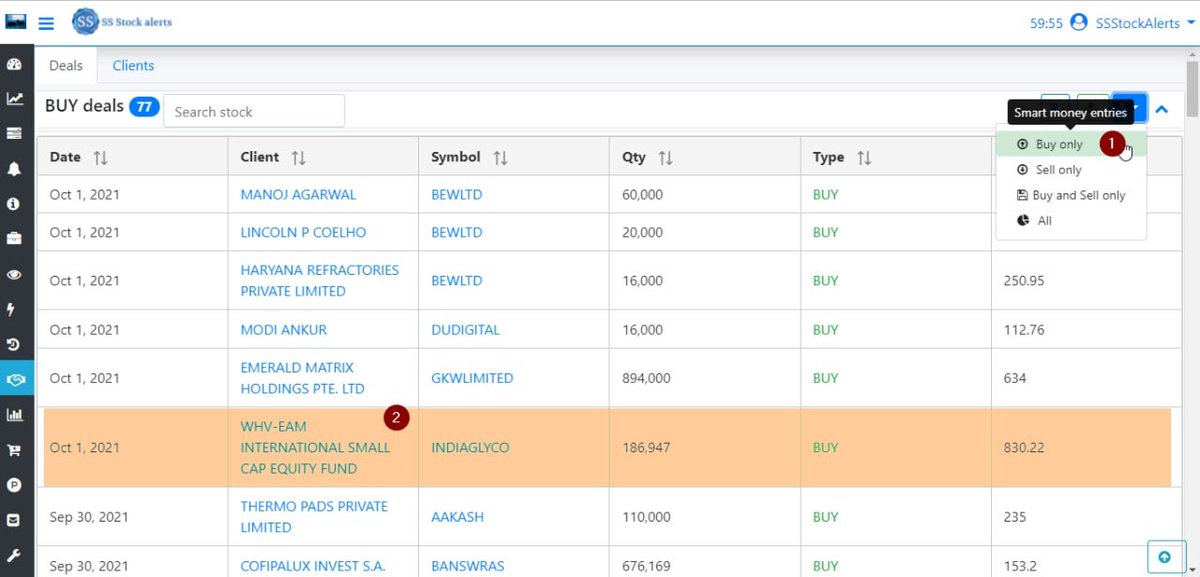
How to know smart money entries easily?
Simply go to
https://t.co/KVSw24ngG7
Click on buy only option which shows only smart money entries.
Buy only means -> Client only bought these stocks and didn't do intraday on that.
More from SSStockAlerts
#CDSL
- Stock rallied to 986 from 789(25%) in just 23days.
- Able to catch the momentum stock near its area of value.
- Find out the stocks which respect which moving average using our AOV analysis and know this type of stocks earlier before bigger move.
- Stock rallied to 986 from 789(25%) in just 23days.
- Able to catch the momentum stock near its area of value.
- Find out the stocks which respect which moving average using our AOV analysis and know this type of stocks earlier before bigger move.
#Areaofvalue analysis#CDSL
— SSStockAlerts (@ssstockalerts) May 6, 2021
Buy near 21 SMA support. This stock respects 21 SMA for 84% time. Backtested for last 1 year.
Candle size is getting smaller and volume also less then avg volume.
Any time it can reverse from here.
Help/Supporthttps://t.co/rRCfjf3KIi pic.twitter.com/KGyyAAQ1tV
#cdsl now trading at 817 from 789..
More fireworks yet to come above 827 BO
This is power of AOV analysis feature.
More fireworks yet to come above 827 BO
This is power of AOV analysis feature.
#Areaofvalue analysis#CDSL
— SSStockAlerts (@ssstockalerts) May 6, 2021
Buy near 21 SMA support. This stock respects 21 SMA for 84% time. Backtested for last 1 year.
Candle size is getting smaller and volume also less then avg volume.
Any time it can reverse from here.
Help/Supporthttps://t.co/rRCfjf3KIi pic.twitter.com/KGyyAAQ1tV
Dear Friends,
#Sssnewfeature
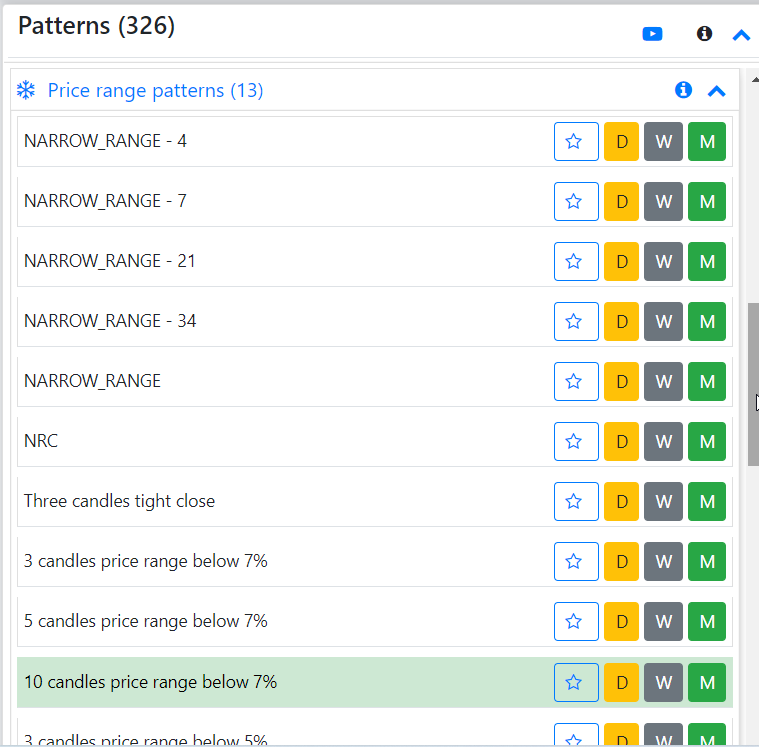
We have implemented the Price range scans to identify which are in the tight price range for the last few days. Use these scans along with the other scans like the Mark Minervini pattern(High momentum).
@krishchess @Techtrades365
1/n
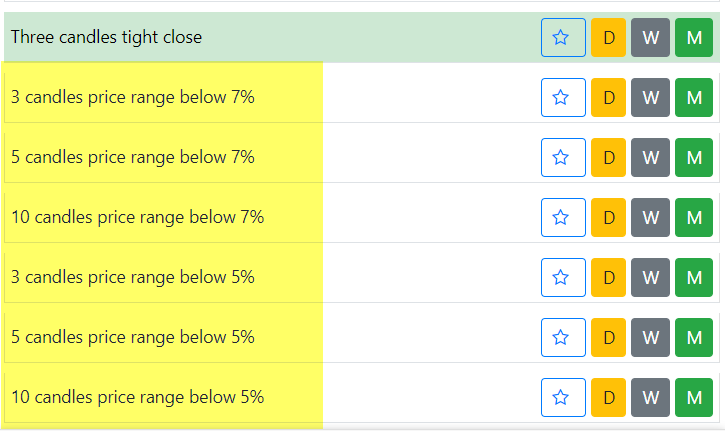
- These scans can help to find out the stocks whose range is < 5% or 7%.
1. 3 candles price range below 7%
2. 5 candles price range below 7%
3. 10 candles price range below 7%
4. 3 candles price range below 5%
5. 5 candles price range below 5%
6. 10 candles price range below 5%
Why range is important?
When you enter into a trade, for setting up a stop loss if we get the stocks within the 7% price range then we can keep our sl with less than 7%.
- As per Mark Minervini, don't keep the SL with more than 8%.
https://t.co/RkaOwvfBaq
Scans => price range
#Sssnewfeature
We have implemented the Price range scans to identify which are in the tight price range for the last few days. Use these scans along with the other scans like the Mark Minervini pattern(High momentum).
@krishchess @Techtrades365
1/n
- These scans can help to find out the stocks whose range is < 5% or 7%.
1. 3 candles price range below 7%
2. 5 candles price range below 7%
3. 10 candles price range below 7%
4. 3 candles price range below 5%
5. 5 candles price range below 5%
6. 10 candles price range below 5%
Why range is important?
When you enter into a trade, for setting up a stop loss if we get the stocks within the 7% price range then we can keep our sl with less than 7%.
- As per Mark Minervini, don't keep the SL with more than 8%.
https://t.co/RkaOwvfBaq
Scans => price range
More from Screeners


And here it is:
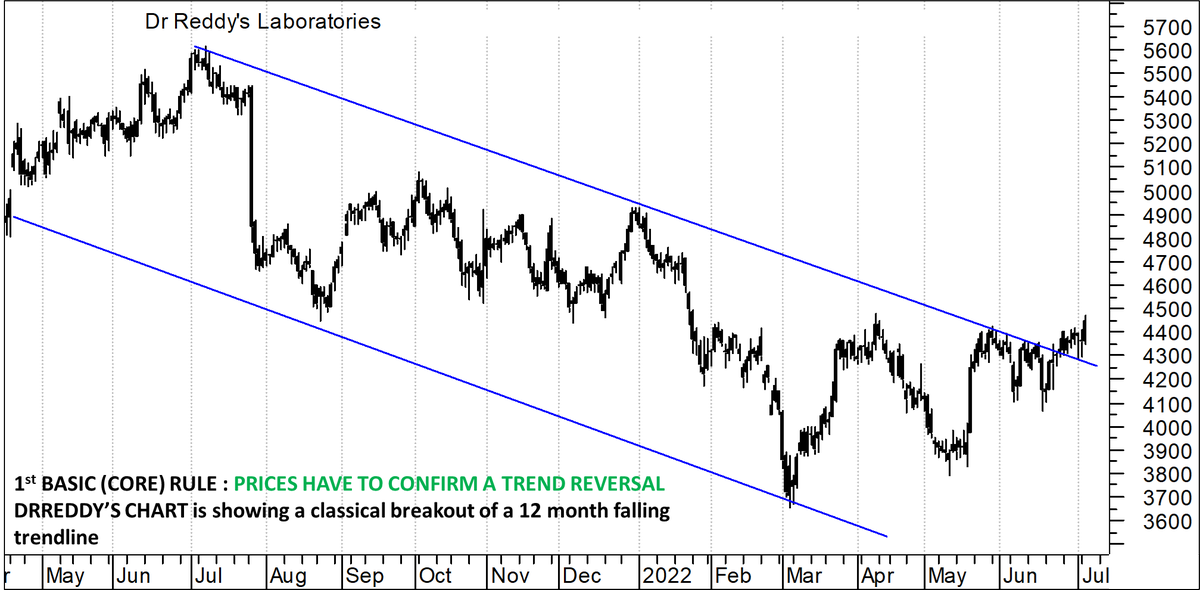
The 3 most important rules which I follow in spotting a major trend reversal laid out in this stock, 'as it is'.
1. Trend reversal
2. Price patterns
3. Indicator confirmation
Perfect TA chart.
All boxes ticked !!
Do comment, like and share !!!
#DRREDDY https://t.co/4JGg71GenE
The 3 most important rules which I follow in spotting a major trend reversal laid out in this stock, 'as it is'.
1. Trend reversal
2. Price patterns
3. Indicator confirmation
Perfect TA chart.
All boxes ticked !!
Do comment, like and share !!!
#DRREDDY https://t.co/4JGg71GenE
Today at 2 pm:
— Kunal Bothra (@kbbothra) July 5, 2022
I will bring to you one of the SUPER FINEST TECHNICAL CHART setup on a largecap name.
Agar yeh nahi chal paya toh kuch nahi chal paayega\u2026
Retweeet tsunami has to come for this one\u2026 #stock #breakout #technical