If you look into the #weekly #chart you can see clearly if a #stock is under #accumulation or #distribution.
– If volume is above average and it was an UP week, it's accumulation.
– If volume is above average and it was a DOWN week, it's distribution.
@BlogJulianKomar
More from SSStockAlerts
Dear Friends,
#sssnewfeature
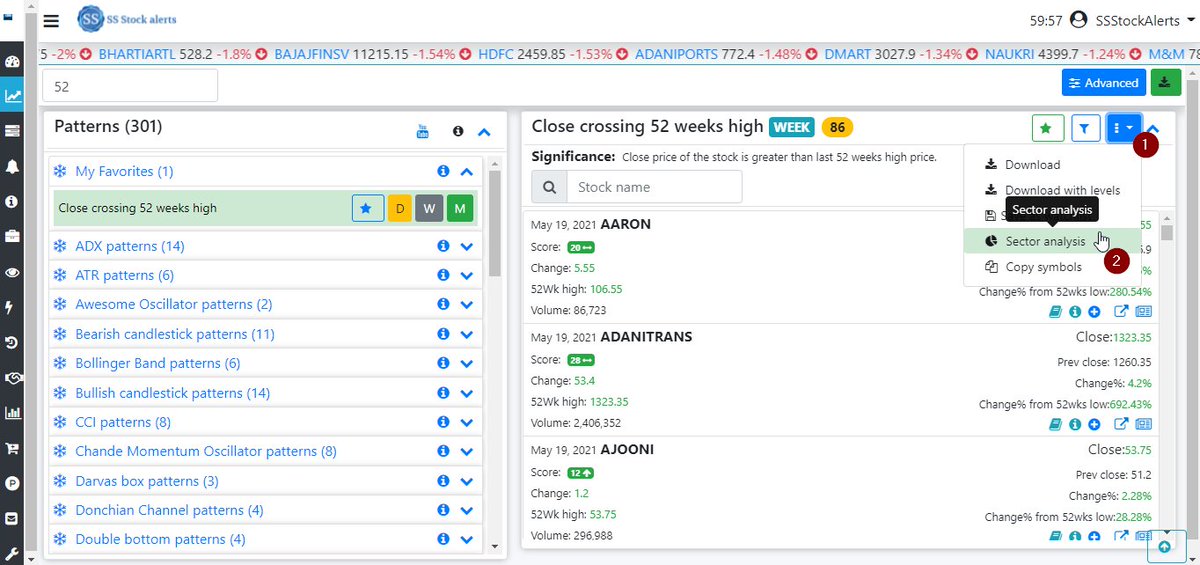
We have implemented sector chart analysis feature and it is available from Scans, Positional and Analysis pages.
Power is given to you. Step ahead with your analysis with leading sectors analysis https://t.co/7rQ5UjCd2J
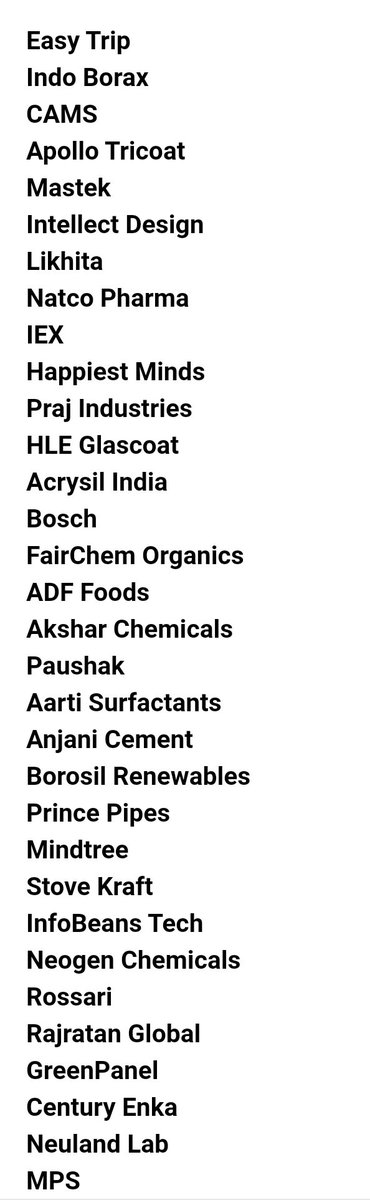
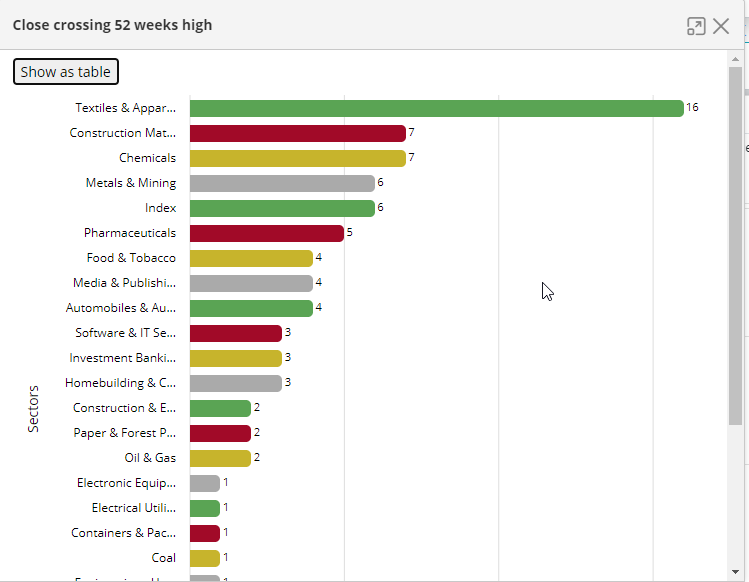
- 52 weeks high breakout stocks analysis
- You can see them in tabular format as well and get list of stocks for each sector also.
- Enhanced filter to support these sectors, so you can apply these sectors in filter also.
#sssnewfeature
We have implemented sector chart analysis feature and it is available from Scans, Positional and Analysis pages.
Power is given to you. Step ahead with your analysis with leading sectors analysis https://t.co/7rQ5UjCd2J
Dear Friends,
— SSStockAlerts (@ssstockalerts) May 19, 2021
A Sector analysis for scans feature will be added to site.
Eg:- See analysis for 52weeks high breakout, from text tile sector has more breakouts, so concentrate on Textile sector pic.twitter.com/U0cIoEeKDy
- 52 weeks high breakout stocks analysis
- You can see them in tabular format as well and get list of stocks for each sector also.
- Enhanced filter to support these sectors, so you can apply these sectors in filter also.
Dear Friends,
#Sssnewfeature
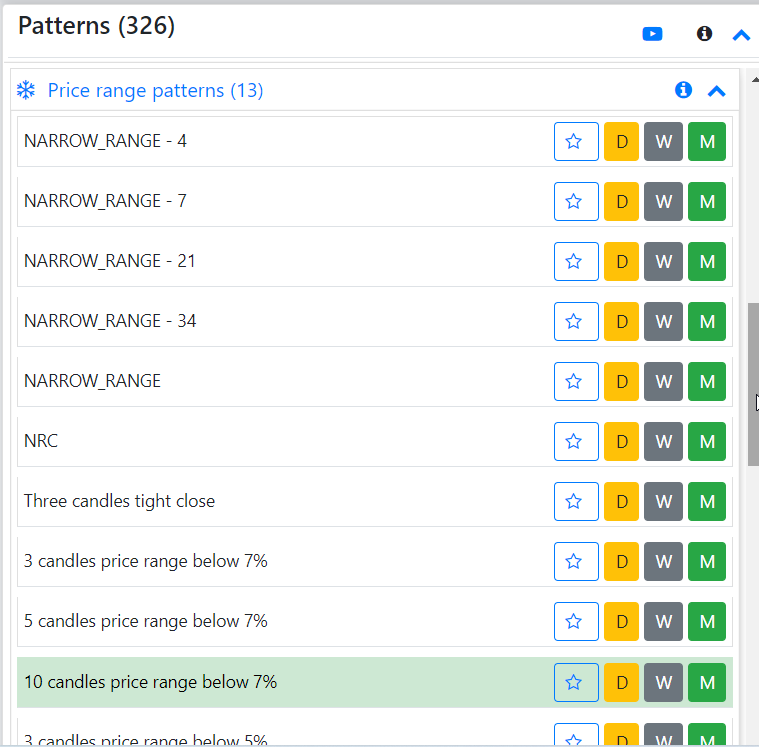
We have implemented the Price range scans to identify which are in the tight price range for the last few days. Use these scans along with the other scans like the Mark Minervini pattern(High momentum).
@krishchess @Techtrades365
1/n
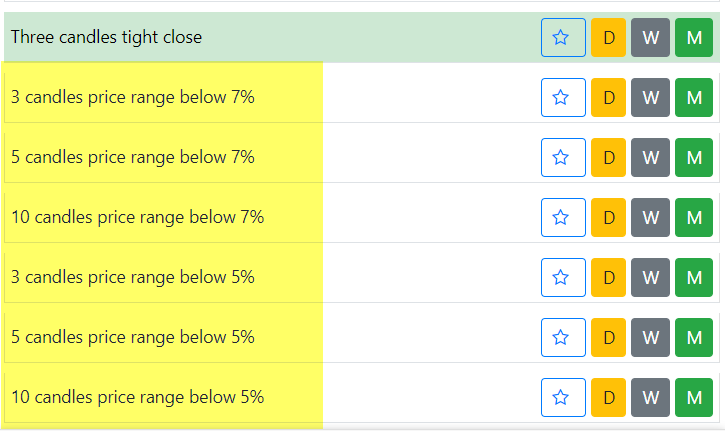
- These scans can help to find out the stocks whose range is < 5% or 7%.
1. 3 candles price range below 7%
2. 5 candles price range below 7%
3. 10 candles price range below 7%
4. 3 candles price range below 5%
5. 5 candles price range below 5%
6. 10 candles price range below 5%
Why range is important?
When you enter into a trade, for setting up a stop loss if we get the stocks within the 7% price range then we can keep our sl with less than 7%.
- As per Mark Minervini, don't keep the SL with more than 8%.
https://t.co/RkaOwvfBaq
Scans => price range
#Sssnewfeature
We have implemented the Price range scans to identify which are in the tight price range for the last few days. Use these scans along with the other scans like the Mark Minervini pattern(High momentum).
@krishchess @Techtrades365
1/n
- These scans can help to find out the stocks whose range is < 5% or 7%.
1. 3 candles price range below 7%
2. 5 candles price range below 7%
3. 10 candles price range below 7%
4. 3 candles price range below 5%
5. 5 candles price range below 5%
6. 10 candles price range below 5%
Why range is important?
When you enter into a trade, for setting up a stop loss if we get the stocks within the 7% price range then we can keep our sl with less than 7%.
- As per Mark Minervini, don't keep the SL with more than 8%.
https://t.co/RkaOwvfBaq
Scans => price range
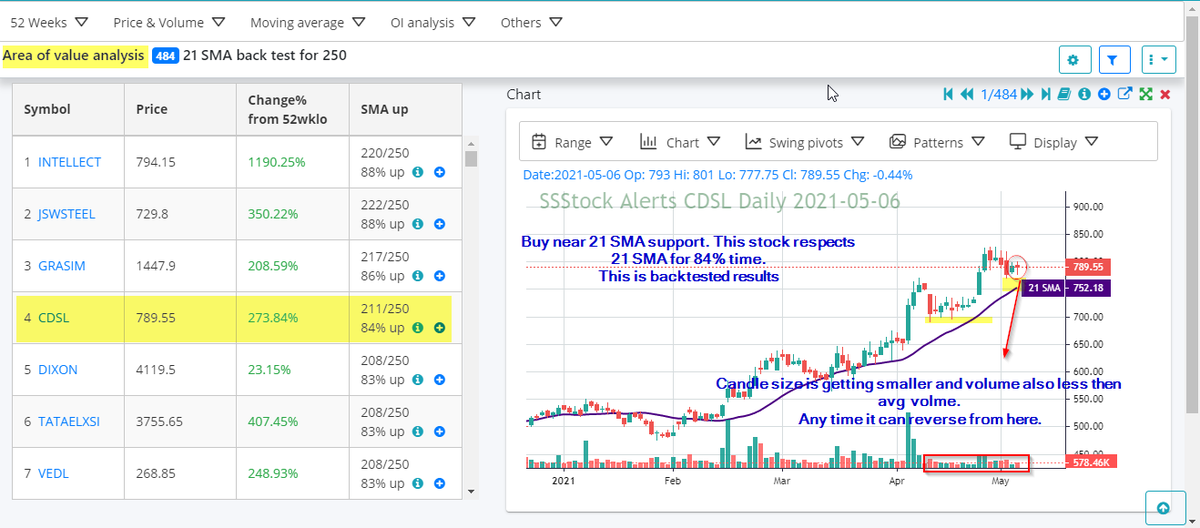
#cdsl now trading at 817 from 789..
More fireworks yet to come above 827 BO
This is power of AOV analysis feature.
More fireworks yet to come above 827 BO
This is power of AOV analysis feature.
#Areaofvalue analysis#CDSL
— SSStockAlerts (@ssstockalerts) May 6, 2021
Buy near 21 SMA support. This stock respects 21 SMA for 84% time. Backtested for last 1 year.
Candle size is getting smaller and volume also less then avg volume.
Any time it can reverse from here.
Help/Supporthttps://t.co/rRCfjf3KIi pic.twitter.com/KGyyAAQ1tV