#cdsl now trading at 817 from 789..
More fireworks yet to come above 827 BO
This is power of AOV analysis feature.
#Areaofvalue analysis#CDSL
— SSStockAlerts (@ssstockalerts) May 6, 2021
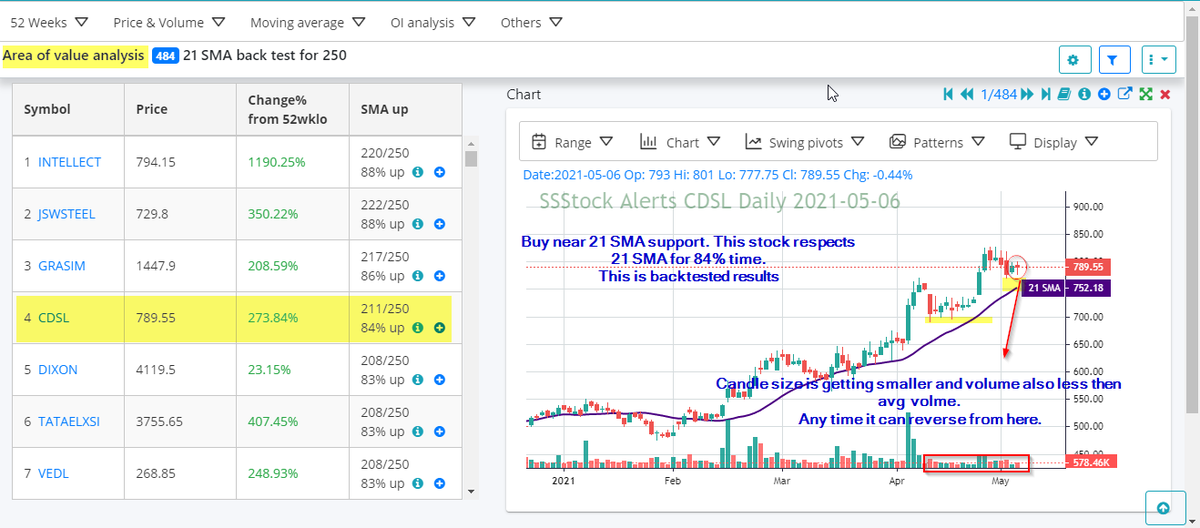
Buy near 21 SMA support. This stock respects 21 SMA for 84% time. Backtested for last 1 year.
Candle size is getting smaller and volume also less then avg volume.
Any time it can reverse from here.
Help/Supporthttps://t.co/rRCfjf3KIi pic.twitter.com/KGyyAAQ1tV
More from SSStockAlerts
#sssnewfeature
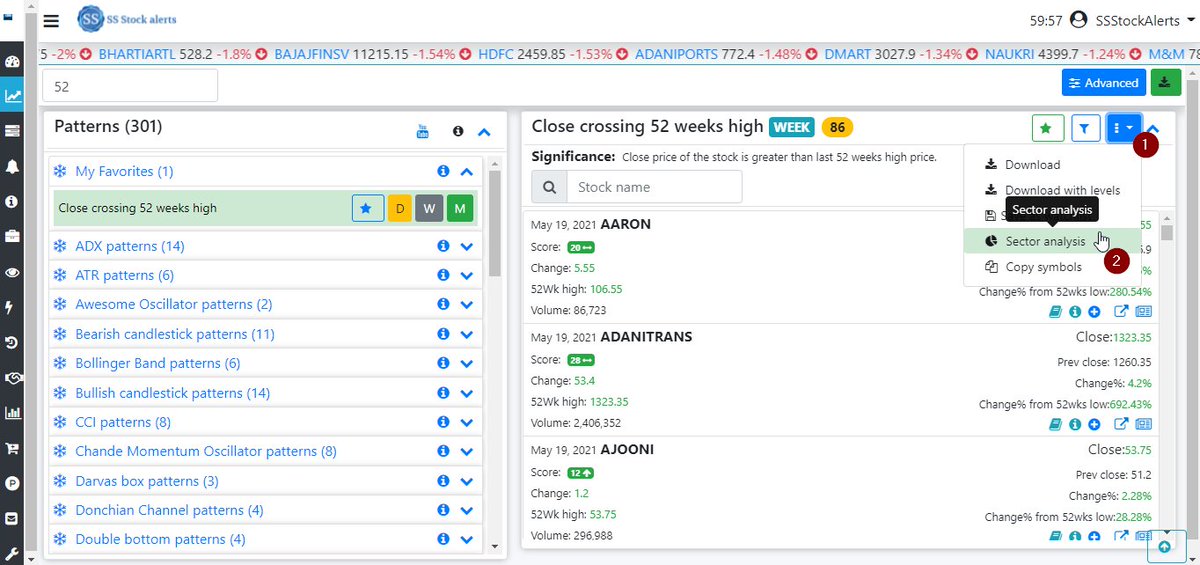
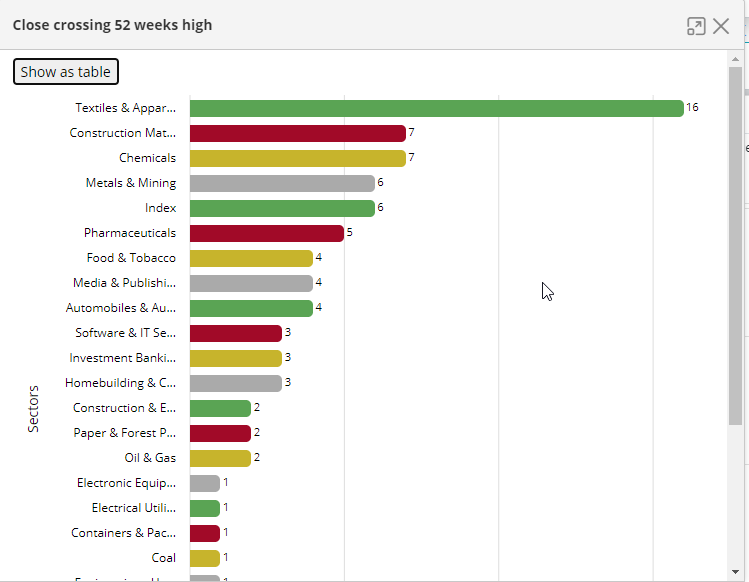
We have implemented sector chart analysis feature and it is available from Scans, Positional and Analysis pages.
Power is given to you. Step ahead with your analysis with leading sectors analysis https://t.co/7rQ5UjCd2J
Dear Friends,
— SSStockAlerts (@ssstockalerts) May 19, 2021
A Sector analysis for scans feature will be added to site.
Eg:- See analysis for 52weeks high breakout, from text tile sector has more breakouts, so concentrate on Textile sector pic.twitter.com/U0cIoEeKDy
- 52 weeks high breakout stocks analysis
- You can see them in tabular format as well and get list of stocks for each sector also.
- Enhanced filter to support these sectors, so you can apply these sectors in filter also.
- Stock rallied to 986 from 789(25%) in just 23days.
- Able to catch the momentum stock near its area of value.
- Find out the stocks which respect which moving average using our AOV analysis and know this type of stocks earlier before bigger move.
#Areaofvalue analysis#CDSL
— SSStockAlerts (@ssstockalerts) May 6, 2021
Buy near 21 SMA support. This stock respects 21 SMA for 84% time. Backtested for last 1 year.
Candle size is getting smaller and volume also less then avg volume.
Any time it can reverse from here.
Help/Supporthttps://t.co/rRCfjf3KIi pic.twitter.com/KGyyAAQ1tV
#Sssnewfeature
We have implemented the Price range scans to identify which are in the tight price range for the last few days. Use these scans along with the other scans like the Mark Minervini pattern(High momentum).
@krishchess @Techtrades365
1/n
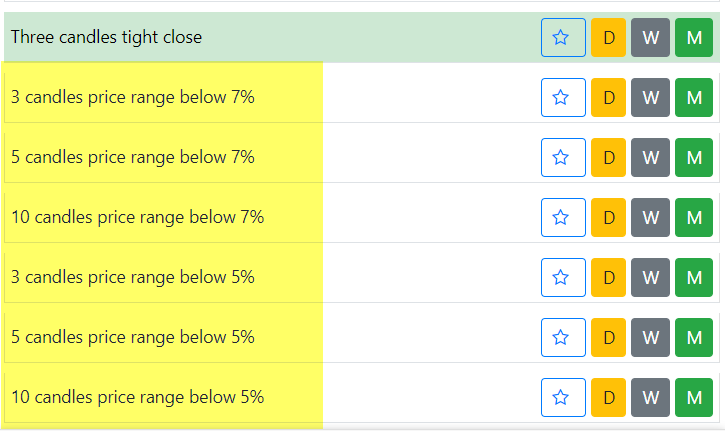
- These scans can help to find out the stocks whose range is < 5% or 7%.
1. 3 candles price range below 7%
2. 5 candles price range below 7%
3. 10 candles price range below 7%
4. 3 candles price range below 5%
5. 5 candles price range below 5%
6. 10 candles price range below 5%
Why range is important?
When you enter into a trade, for setting up a stop loss if we get the stocks within the 7% price range then we can keep our sl with less than 7%.
- As per Mark Minervini, don't keep the SL with more than 8%.
https://t.co/RkaOwvfBaq
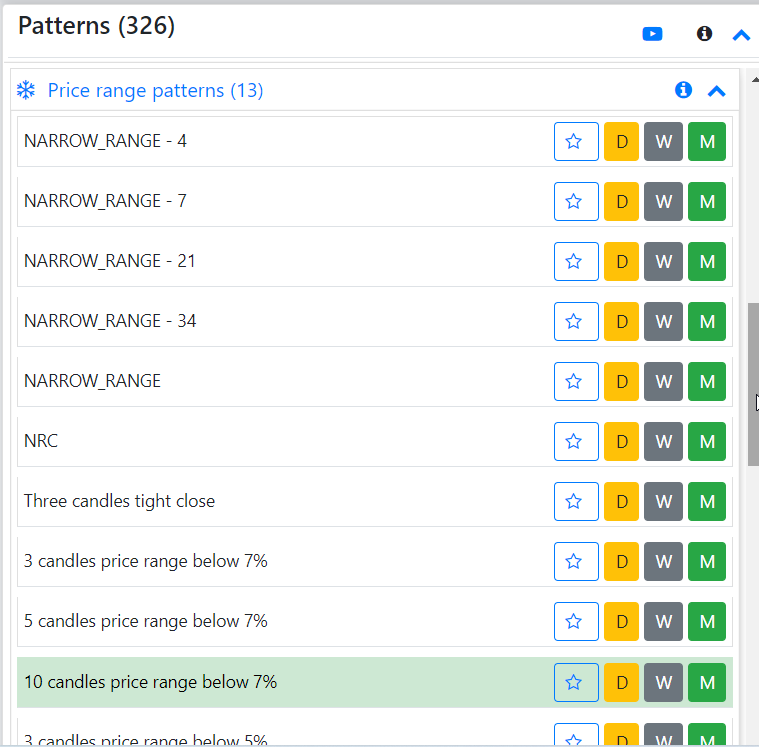
Scans => price range
More from Cdsl

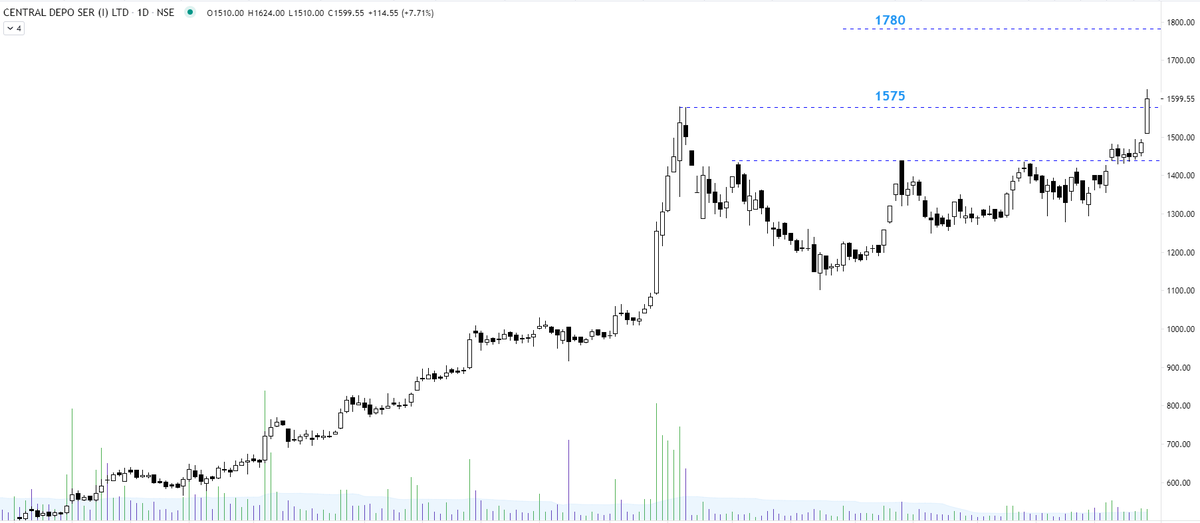
Either entry only above 1600 or let it
correct towards 987...
#Update
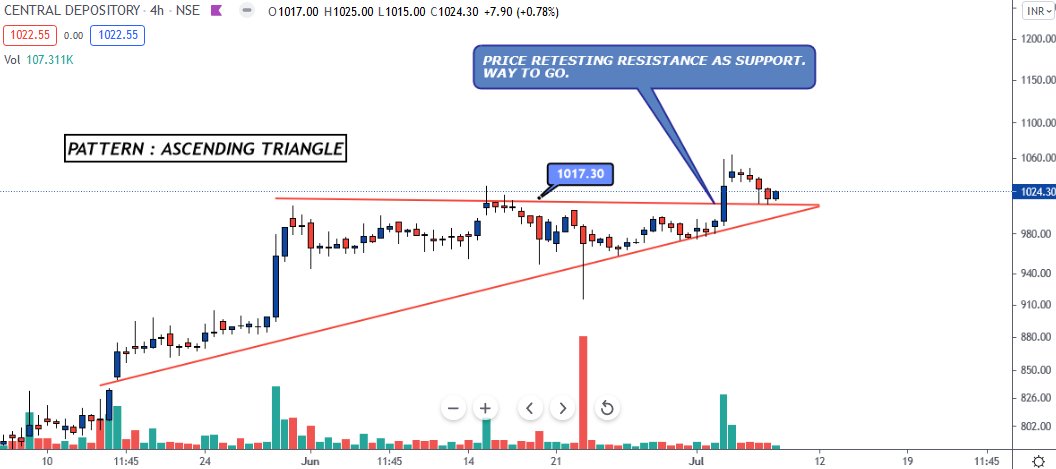
#CDSL -1050
— MaRkET WaVES (DINESH PATEL ) Stock Market FARMER (@idineshptl) July 9, 2021
Now above 2.618% and objective is to move higher towards 3.618%
4.236% and 4.618%....
What will Drag lower this stock price \U0001f602 ?
Only if you can sell your holding
Means Verticle rise ?
Than why it decline from (486-180.)#Observation #Perspective pic.twitter.com/evxYOjH8Qv




You May Also Like

He's STILL in charge of the Mueller investigation.
He's STILL refusing to hand over the McCabe memos.
He's STILL holding up the declassification of the #SpyGate documents & their release to the public.
I love a good cover story.......
The guy had a face-to-face with El Grande Trumpo himself on Air Force One just 2 days ago. Inside just about the most secure SCIF in the world.
And Trump came out of AF1 and gave ol' Rod a big thumbs up!
And so we're right back to 'that dirty rat Rosenstein!' 2 days later.
At this point it's clear some members of Congress are either in on this and helping the cover story or they haven't got a clue and are out in the cold.
Note the conflicting stories about 'Rosenstein cancelled meeting with Congress on Oct 11!"
First, rumors surfaced of a scheduled meeting on Oct. 11 between Rosenstein & members of Congress, and Rosenstein just cancelled it.
Rep. Andy Biggs and Rep. Matt Gaetz say DAG Rod Rosenstein cancelled an Oct. 11 appearance before the judiciary and oversight committees. They are now calling for a subpoena. pic.twitter.com/TknVHKjXtd
— Ivan Pentchoukov \U0001f1fa\U0001f1f8 (@IvanPentchoukov) October 10, 2018

The question is:
Is this an official account for Bahcesehir Uni (Bau)?

Bahcesehir Uni, BAU has an official website https://t.co/ztzX6uj34V which links to their social media, leading to their Twitter account @Bahcesehir
BAU’s official Twitter account

BAU has many departments, which all have separate accounts. Nowhere among them did I find @BAUDEGS
@BAUOrganization @ApplyBAU @adayBAU @BAUAlumniCenter @bahcesehirfbe @baufens @CyprusBau @bauiisbf @bauglobal @bahcesehirebe @BAUintBatumi @BAUiletisim @BAUSaglik @bauebf @TIPBAU
Nowhere among them was @BAUDEGS to find