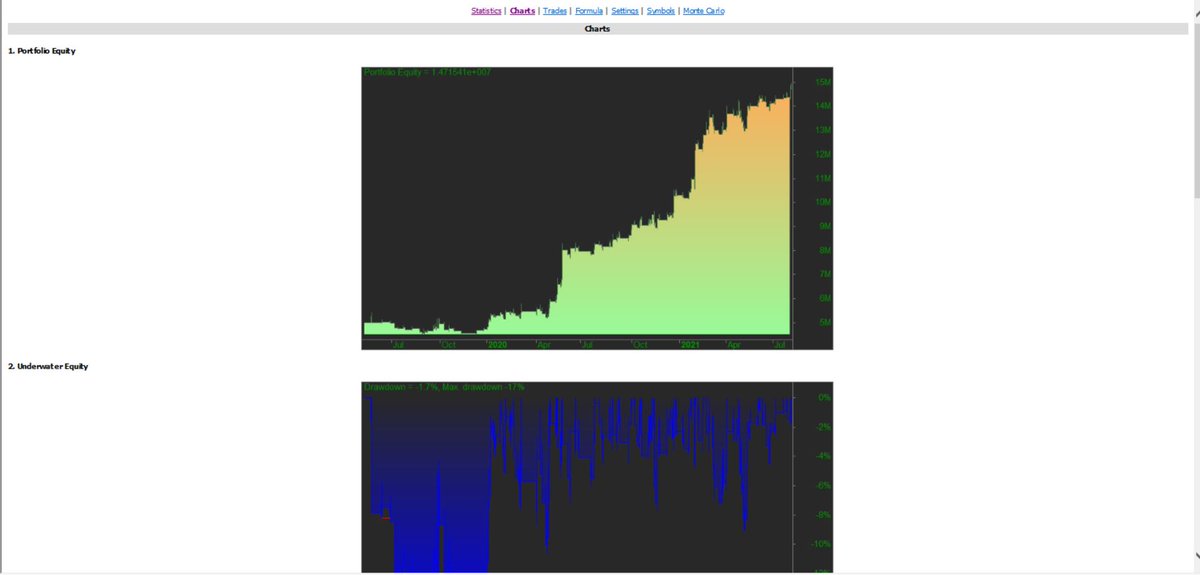
if u are looking to scan the stocks which are moving in tight range,
how would u construct a logic for that?
Everyone's suggestions are welcome
More from ProdigalTrader
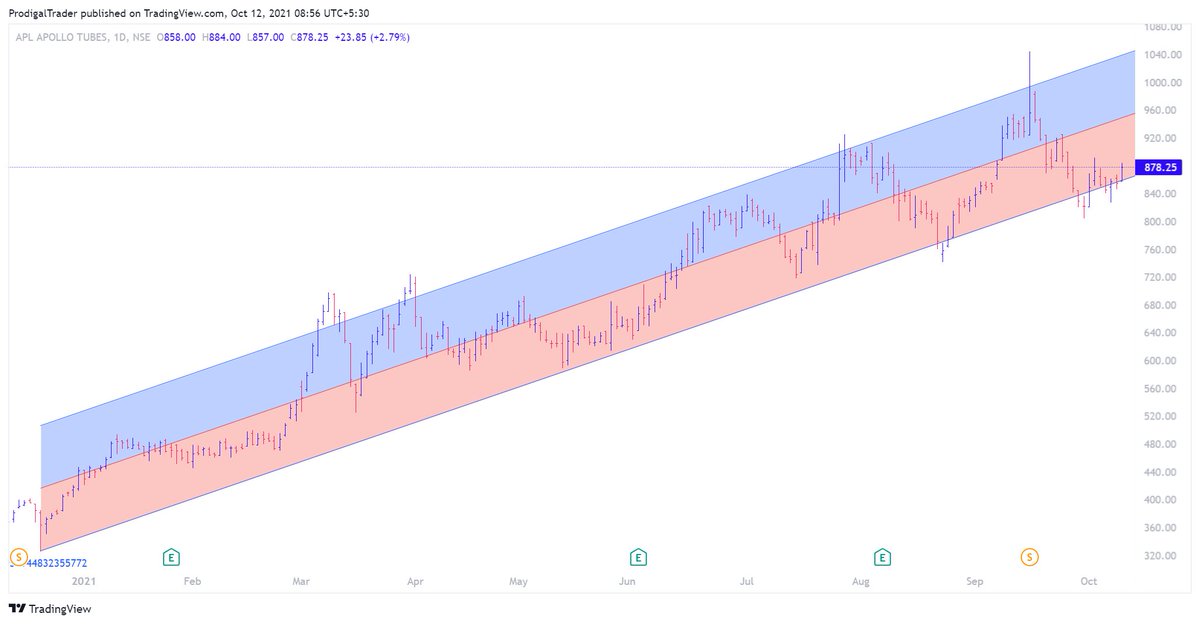
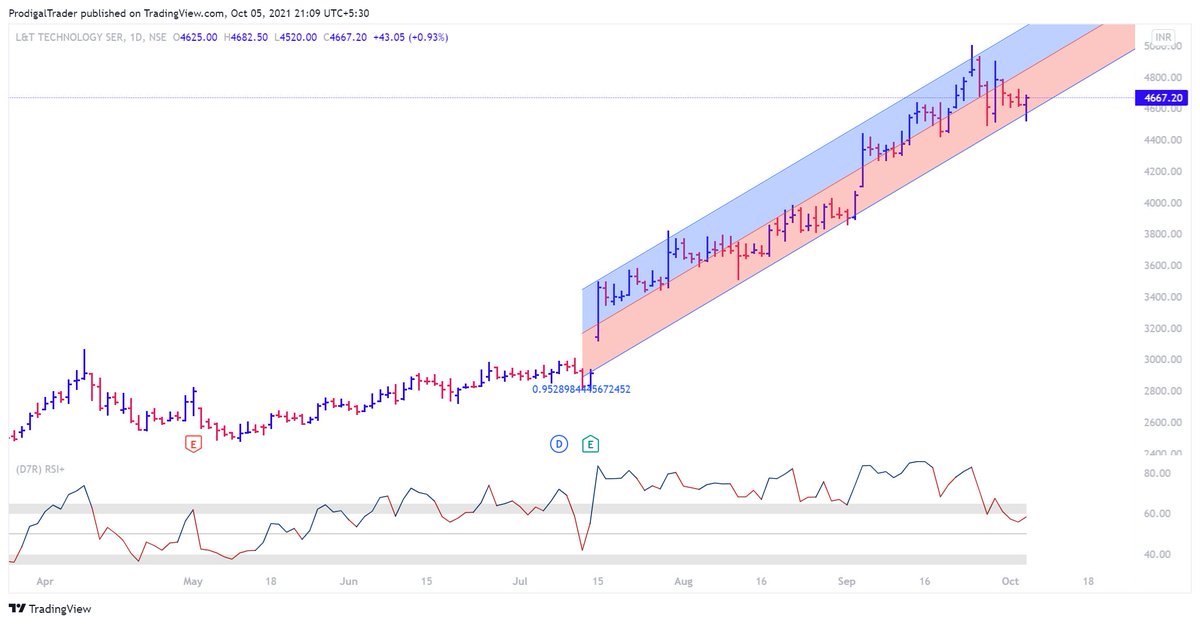
Never trust a slow mover
if demand is enough, it should go up fast
if not, a small increase in supply can trigger substantial fall
#coforge https://t.co/2yJRCUFMIO
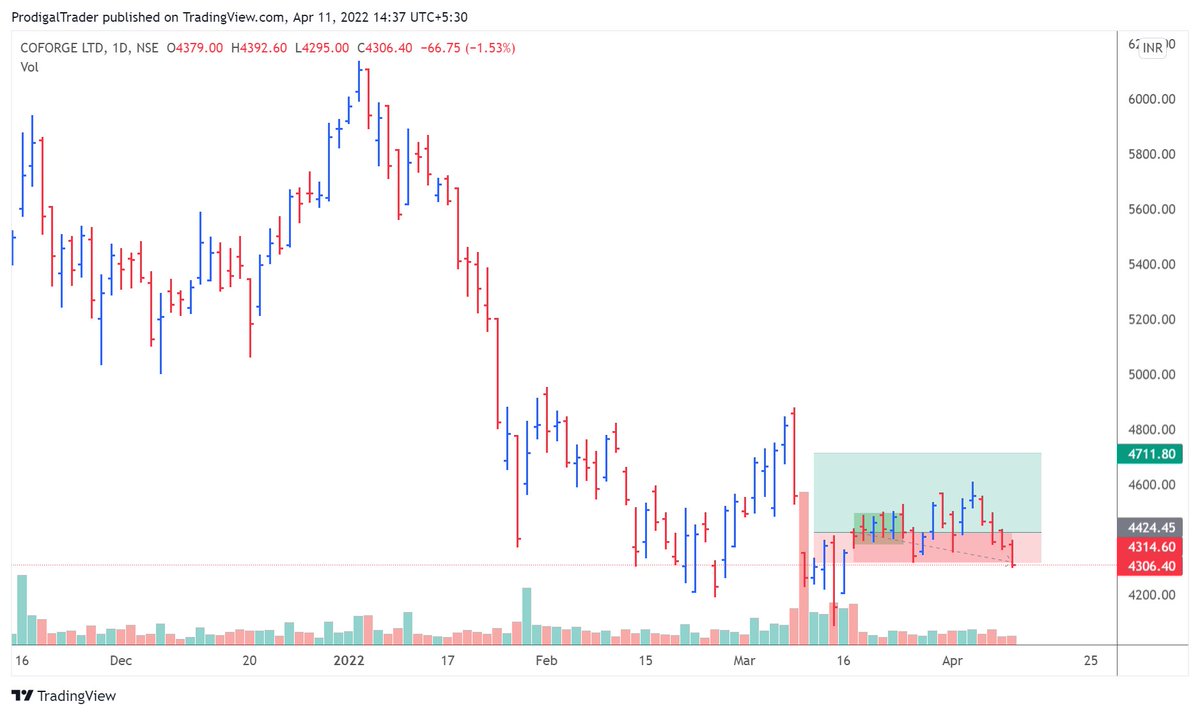
if demand is enough, it should go up fast
if not, a small increase in supply can trigger substantial fall
#coforge https://t.co/2yJRCUFMIO
failing to find momentum
— Aneesh Philomina Antony (ProdigalTrader) (@ProdigalTrader) April 6, 2022
too slow for my liking
4408 - 4508 (0.7R)
cutting it off#coforge https://t.co/NtN2ECRSA4 pic.twitter.com/sz1kH8LPI7
More from Screeners

VWAP for intraday Trading Part -2
A small thread.
PART 1 - https://t.co/ooxepHpYKL
Traders show your support by like & retweet to benefit all
@Mitesh_Engr @ITRADE191 @ProdigalTrader @nakulvibhor @RajarshitaS @Puretechnicals9 @AnandableAnand @Anshi_________ @ca_mehtaravi

Chart 1
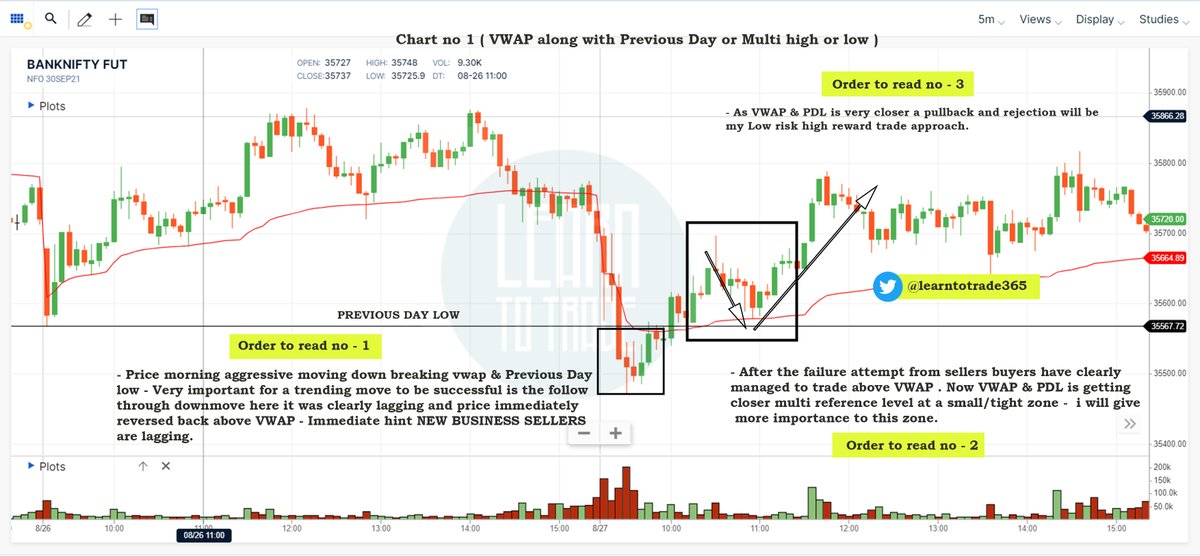
Chart 2
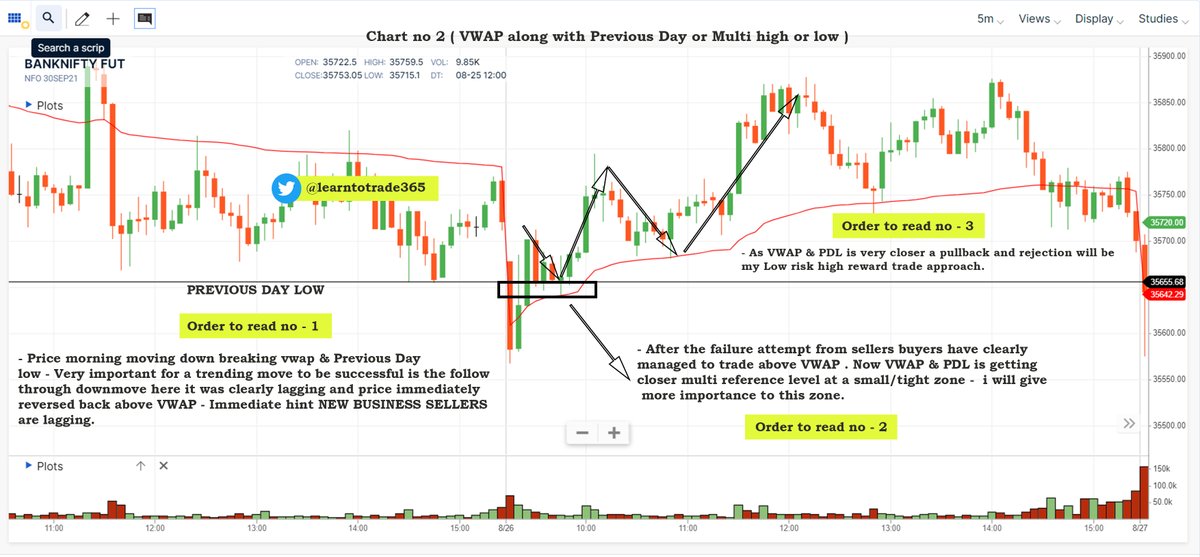
Chart 3
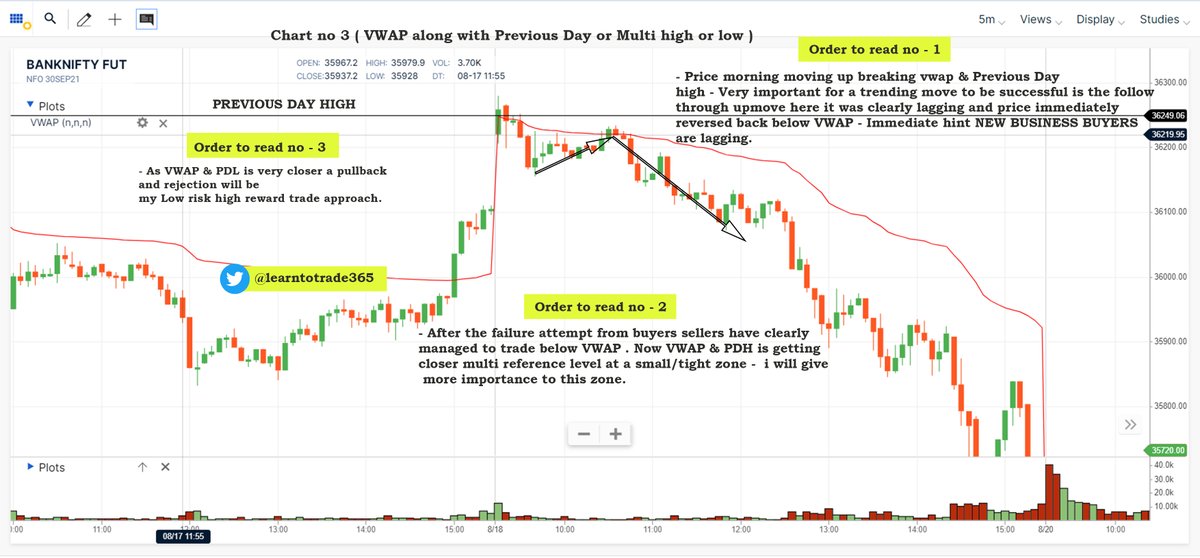
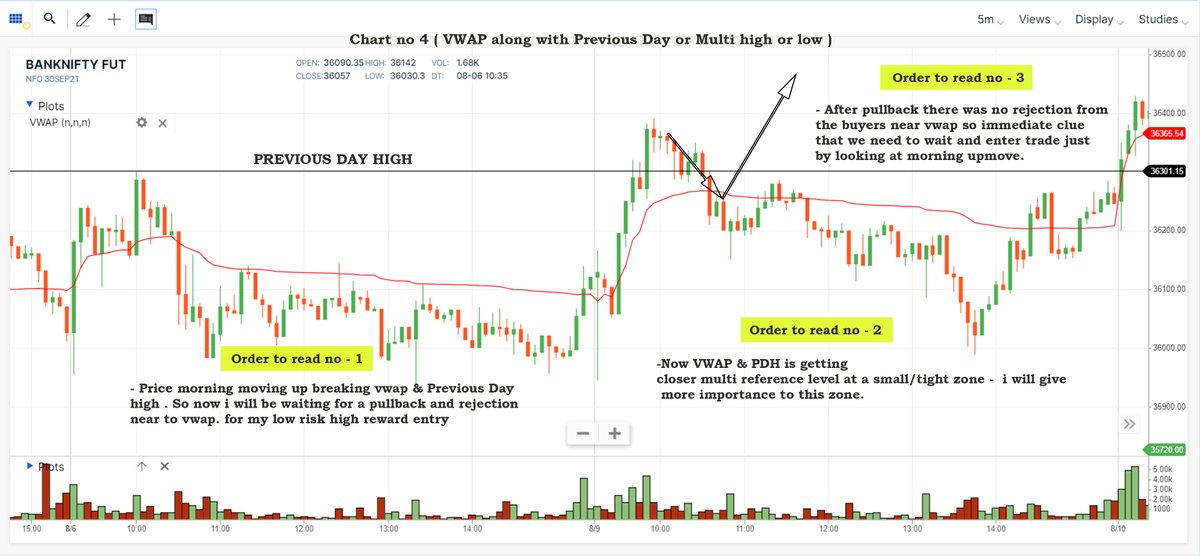
Chart 4
A small thread.
PART 1 - https://t.co/ooxepHpYKL
Traders show your support by like & retweet to benefit all
@Mitesh_Engr @ITRADE191 @ProdigalTrader @nakulvibhor @RajarshitaS @Puretechnicals9 @AnandableAnand @Anshi_________ @ca_mehtaravi
VWAP for intraday Trading Part -1
— Learn to Trade (@learntotrade365) August 28, 2021
A small thread PART -2 will be released tomorrow
Traders show your support by like & retweet to benefit all@Mitesh_Engr @ITRADE191 @ProdigalTrader @nakulvibhor @ArjunB9591 @CAPratik_INDIAN @RajarshitaS @Stockstudy8 @vivbajaj @Prakashplutus pic.twitter.com/y8bwisM4hB
Chart 1
Chart 2
Chart 3
Chart 4