
If u know how ATR, RSI, Bollinger Bands etc. are constructed,
what exactly are they measuring,
how does it disagree with price at times,
how it responds to various trend phases etc
U probably would reckon that indicators works as much as price or volume.
Do u know them well??
More from Aneesh Philomina Antony (ProdigalTrader)
Few concepts upon which day trading systems can be built upon
https://t.co/3eAoEqM7QQ up trending market look for pin bar with good volume
2.Rsi divergence and macd histogram divergence both at the same time on 3 min chart
https://t.co/qrAH9PZ6D3 = Low (15min)
1/7
4.ORB with 15 min candle stick along with support and resistance of previous 5 days
5.Pullbacks in Strong momentum (wide range candles + Volume) stocks
6.ORB with volatility contraction and then wide range candle breakout with volume expansion
2/7
7.Fakeout like spring and Upthrust for entry pullback with low volume
8.CPR analysis with standard pivots
9.PDH/PDL breakout with volume, vwap and RSI confirmation
3/7
10.Horizontal support/resistance from HTF and confirmation of acceptance or rejection in lower timeframe as reversal candlestick patterns with volume confirmation
https://t.co/75kykbExlg writing data and Put Writing data in correlation with price action
4/7
12.Pivots (Fibonacci) and Price action with volume activity
13.Ichimoku set ups with previous day NR4/NR7 scrips with pivots and volume as trading tools
https://t.co/JcwqOZS5L4 and rejections on 100/200 ema
15.EMA20 and rsi divergence with daily trend structure
5/7
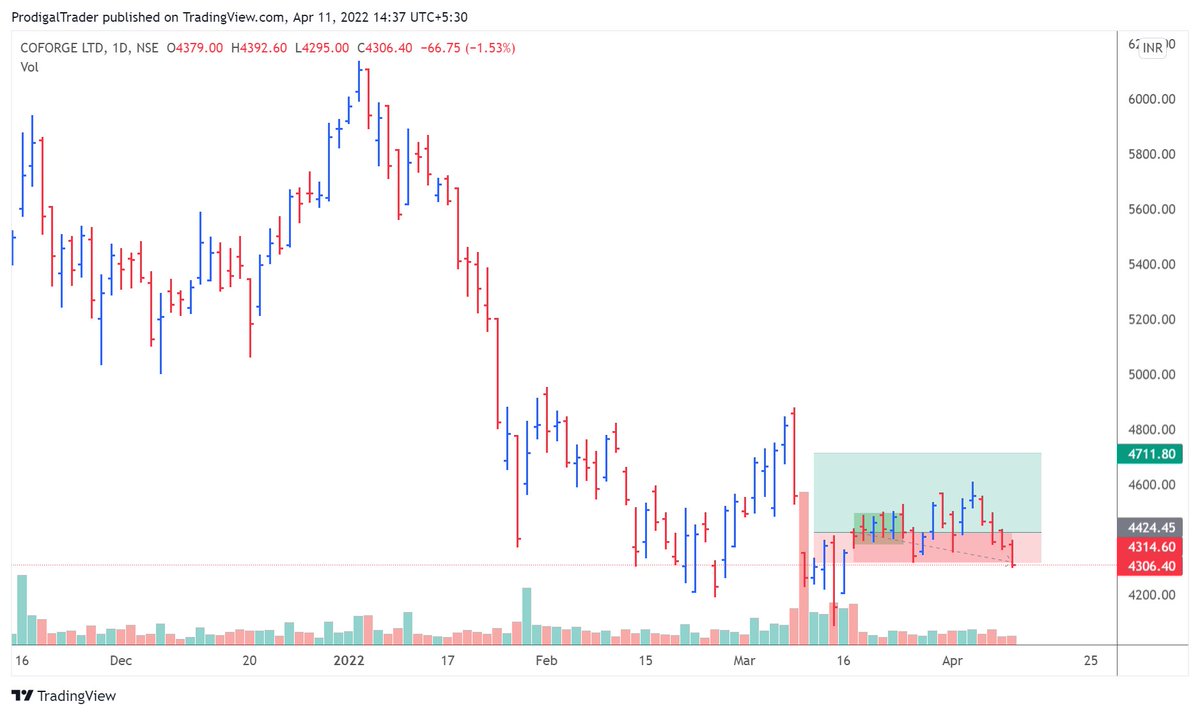
Never trust a slow mover
if demand is enough, it should go up fast
if not, a small increase in supply can trigger substantial fall
#coforge https://t.co/2yJRCUFMIO
if demand is enough, it should go up fast
if not, a small increase in supply can trigger substantial fall
#coforge https://t.co/2yJRCUFMIO
failing to find momentum
— Aneesh Philomina Antony (ProdigalTrader) (@ProdigalTrader) April 6, 2022
too slow for my liking
4408 - 4508 (0.7R)
cutting it off#coforge https://t.co/NtN2ECRSA4 pic.twitter.com/sz1kH8LPI7
More from Screeners


Took me 5 years to get the best Chartink scanners for Stock Market, but you’ll get it in 5 mminutes here ⏰
Do Share the above tweet 👆
These are going to be very simple yet effective pure price action based scanners, no fancy indicators nothing - hope you liked it.
https://t.co/JU0MJIbpRV
52 Week High
One of the classic scanners very you will get strong stocks to Bet on.
https://t.co/V69th0jwBr
Hourly Breakout
This scanner will give you short term bet breakouts like hourly or 2Hr breakout
Volume shocker
Volume spurt in a stock with massive X times

You May Also Like


H was always unseen in S2NL :)
Those who exited at 1500 needed money. They can always come back near 969. Those who exited at 230 also needed money. They can come back near 95.
Those who sold L @ 660 can always come back at 360. Those who sold S last week can be back @ 301
Those who exited at 1500 needed money. They can always come back near 969. Those who exited at 230 also needed money. They can come back near 95.
Those who sold L @ 660 can always come back at 360. Those who sold S last week can be back @ 301
Sir, Log yahan.. 13 days patience nhi rakh sakte aur aap 2013 ki baat kar rahe ho. Even Aap Ready made portfolio banakar bhi de do to bhi wo 1 month me hi EXIT kar denge \U0001f602
— BhavinKhengarSuratGujarat (@IntradayWithBRK) September 19, 2021
Neuland 2700 se 1500 & Sequent 330 to 230 kya huwa.. 99% retailers/investors twitter par charcha n EXIT\U0001f602


