
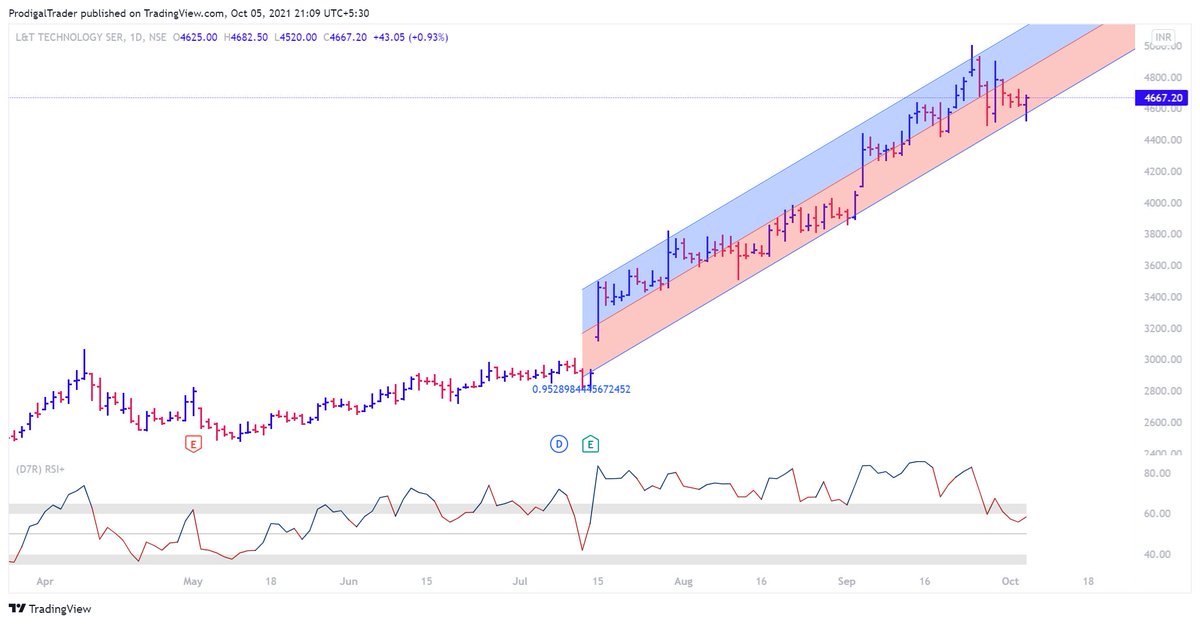
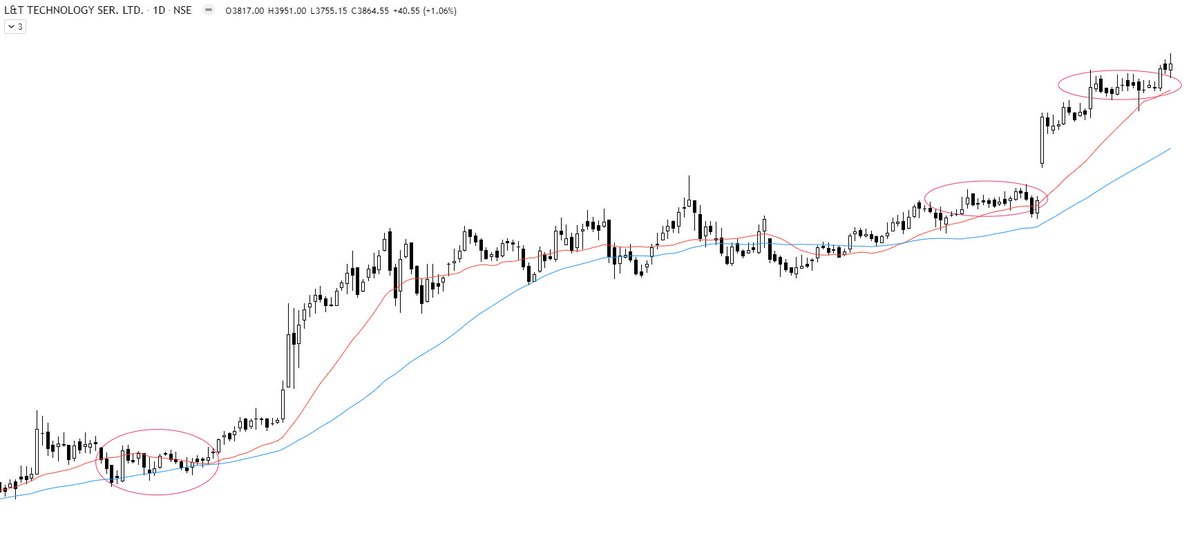
#LTTS
Regression channel usually saves the trend to stay intact. LTTS looks so oversold yet strongly uptrending
Quite a setup it is !!
More from ProdigalTrader
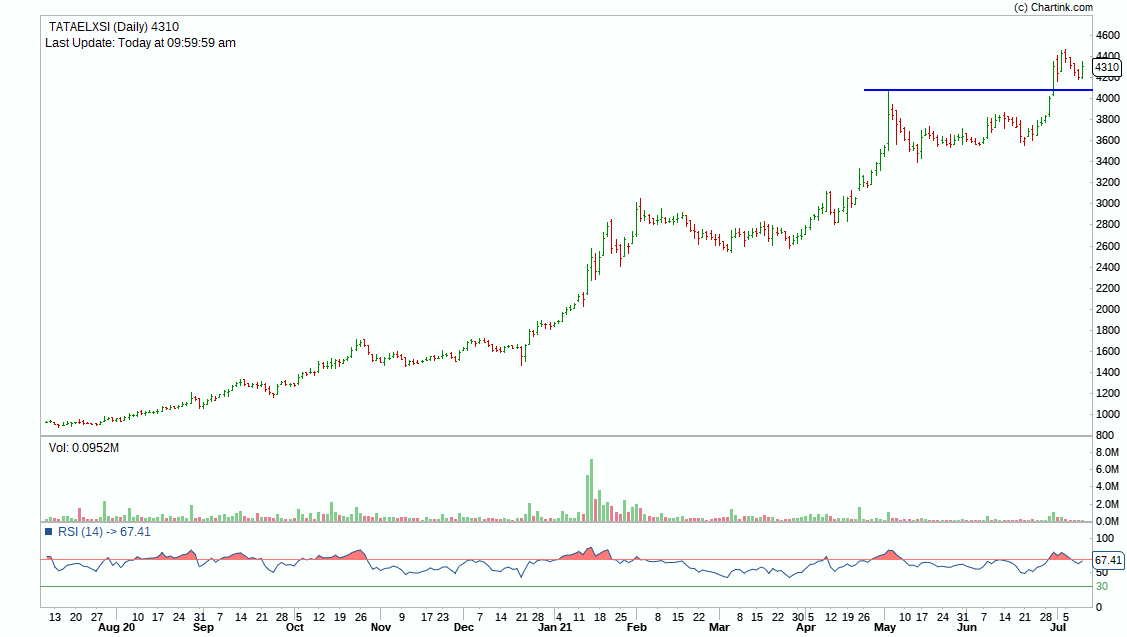
#tataelxsi
2772 - 4455
60% move
it made a fresh breakout recently and looks poised to make further gains
strong stock for huge gains https://t.co/bTizotDqHz
2772 - 4455
60% move
it made a fresh breakout recently and looks poised to make further gains
strong stock for huge gains https://t.co/bTizotDqHz
strong uptrending stock
— Aneesh Philomina Antony (@ProdigalTrader) April 4, 2021
unlikely to accumulate for further long
supply seems to have dried up#tataelxsi pic.twitter.com/btBiDgfxbt
Parameters
1.Price structure - higher swing highs & swing lows
2. Momentum - doubled in last 250 days & trade close to recent highs
3. Demand - Higher volume on green bars
4. Volatility - Bigger bars on upside & shorter on downside
5. Relative strength - Outperforming market
1.Price structure - higher swing highs & swing lows
2. Momentum - doubled in last 250 days & trade close to recent highs
3. Demand - Higher volume on green bars
4. Volatility - Bigger bars on upside & shorter on downside
5. Relative strength - Outperforming market
Hello Aneesh, (1) apart from the volume supported HH-HL formation in ATH or 52 weeks high stocks, what other data point u see to shortlist scrip? (2) How do u estimate the holding period for the scrip? Plz guide
— Rohit Khanna\U0001f1ee\U0001f1f3 (@Rohit_MktWale) March 26, 2022
More from Ltts

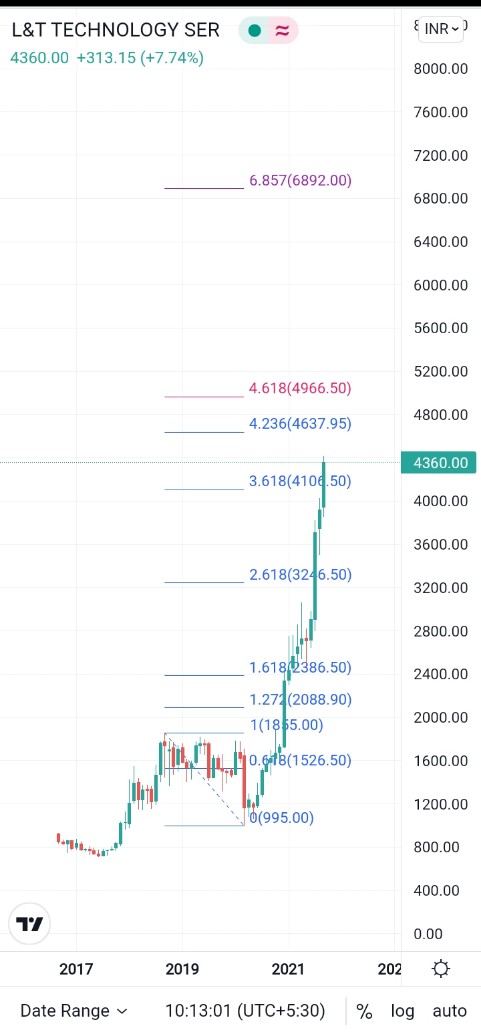


#LTTS
#LLTS Weekly chart shows the stock is recovering from 61.8% fibonacci pullback of last major rise
— Techno Prince (@Trader_souradep) July 24, 2022
Daily chart shows a a rounding bottom , daily RSI bullish
If it sustains above 3500 it can move towards 3900+ levels and later towards 200 DMA 4480#Nifty pic.twitter.com/6ebtfLMJZd


You May Also Like


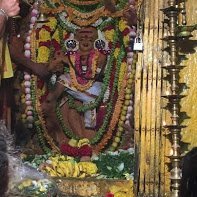
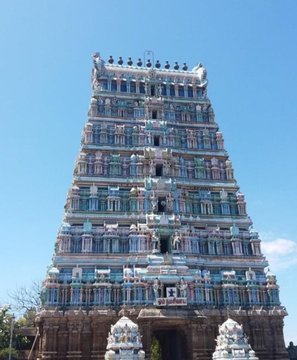
Margatha Natarajar murthi - Uthirakosamangai temple near Ramanathapuram,TN
#ArudraDarisanam
Unique Natarajar made of emerlad is abt 6 feet tall.
It is always covered with sandal paste.Only on Thriuvadhirai Star in month Margazhi-Nataraja can be worshipped without sandal paste.
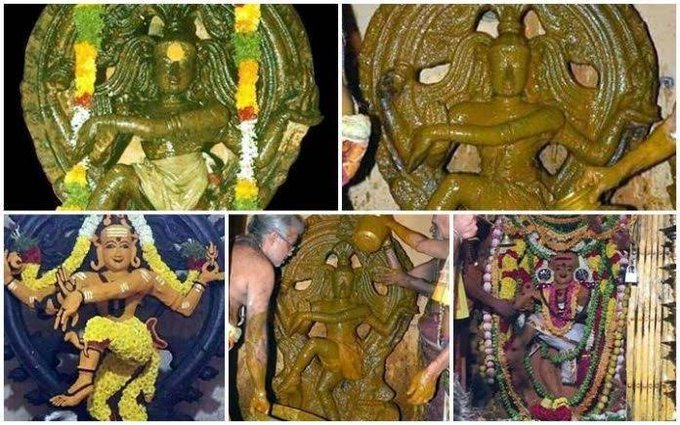
After removing the sandal paste,day long rituals & various abhishekam will be https://t.co/e1Ye8DrNWb day Maragatha Nataraja sannandhi will be closed after anointing the murthi with fresh sandal paste.Maragatha Natarajar is covered with sandal paste throughout the year
as Emerald has scientific property of its molecules getting disturbed when exposed to light/water/sound.This is an ancient Shiva temple considered to be 3000 years old -believed to be where Bhagwan Shiva gave Veda gyaana to Parvati Devi.This temple has some stunning sculptures.
#ArudraDarisanam
Unique Natarajar made of emerlad is abt 6 feet tall.
It is always covered with sandal paste.Only on Thriuvadhirai Star in month Margazhi-Nataraja can be worshipped without sandal paste.
After removing the sandal paste,day long rituals & various abhishekam will be https://t.co/e1Ye8DrNWb day Maragatha Nataraja sannandhi will be closed after anointing the murthi with fresh sandal paste.Maragatha Natarajar is covered with sandal paste throughout the year
as Emerald has scientific property of its molecules getting disturbed when exposed to light/water/sound.This is an ancient Shiva temple considered to be 3000 years old -believed to be where Bhagwan Shiva gave Veda gyaana to Parvati Devi.This temple has some stunning sculptures.


