Of all the 'macro indicators' out there, if i had to choose one to assess risk-reward for equity markets, it would the this 👇
Update: HY yield spread down more than 125 bps since then...\U0001f914 pic.twitter.com/SVrfqB8dMA
— Harish Krishnan,CFA (@hktg13) August 19, 2022
More from Sandeep Kulkarni


This is Nifty's chart from 2004 to 2006. Back then also US interest rates had gone up. Markets had corrected well before Fed had hiked rates for first time in 2004, from then it hiked rates 17 times by 4.25% over next 2 yrs and yet market kept making new highs. @shivaji_1983 pic.twitter.com/EAFhske9EE
— Sandeep Kulkarni (@moneyworks4u_fa) February 11, 2022
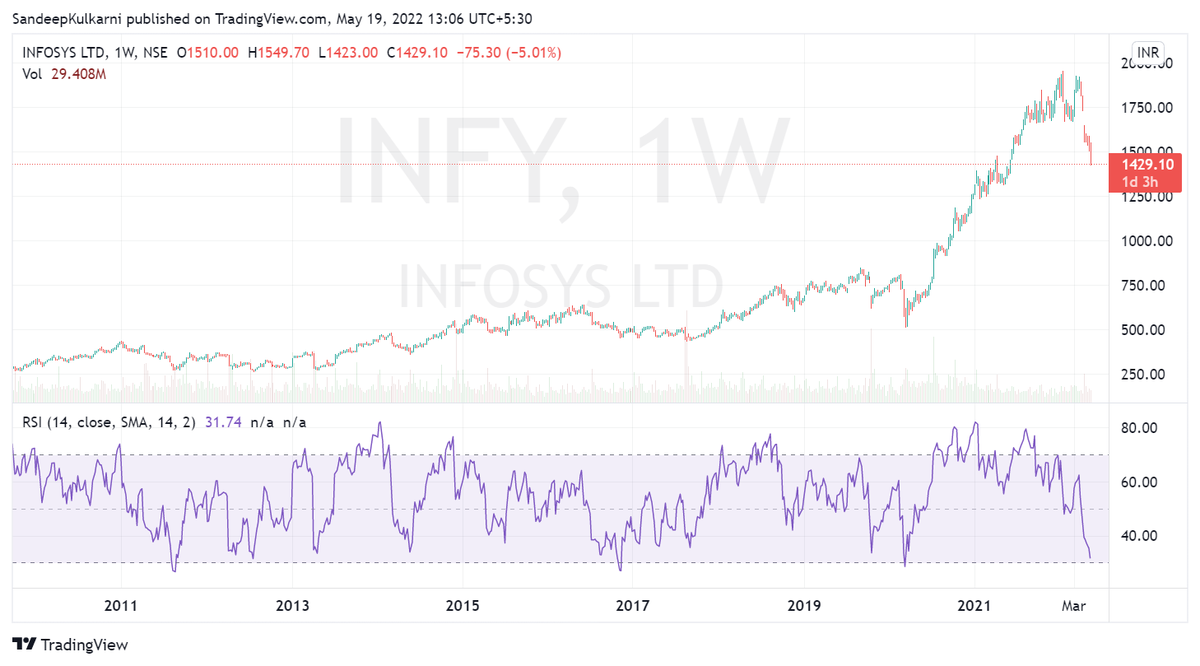
Infosys PEG ratio (1-year fwd PE/EPS growth) down to 1.4x from a peak of 2.7x as PE cut by 27% & EPS growth cut by 5% - trades at 23.3x PE for 11% FY23 growth. If this is a mid-cycle correction, its done BUT if this is the great valuation reset - more fall coming
— ThirdSide (@_ThirdSide_) May 25, 2022
Place your bets pic.twitter.com/9ZlaLDcxPZ
More from Screeners


You May Also Like

Imagine for a moment the most obscurantist, jargon-filled, po-mo article the politically correct academy might produce. Pure SJW nonsense. Got it? Chances are you're imagining something like the infamous "Feminist Glaciology" article from a few years back.https://t.co/NRaWNREBvR pic.twitter.com/qtSFBYY80S
— Jeffrey Sachs (@JeffreyASachs) October 13, 2018
The article is, at heart, deeply weird, even essentialist. Here, for example, is the claim that proposing climate engineering is a "man" thing. Also a "man" thing: attempting to get distance from a topic, approaching it in a disinterested fashion.

Also a "man" thing—physical courage. (I guess, not quite: physical courage "co-constitutes" masculinist glaciology along with nationalism and colonialism.)

There's criticism of a New York Times article that talks about glaciology adventures, which makes a similar point.

At the heart of this chunk is the claim that glaciology excludes women because of a narrative of scientific objectivity and physical adventure. This is a strong claim! It's not enough to say, hey, sure, sounds good. Is it true?