A Screener combination on ADX and Darvas filters
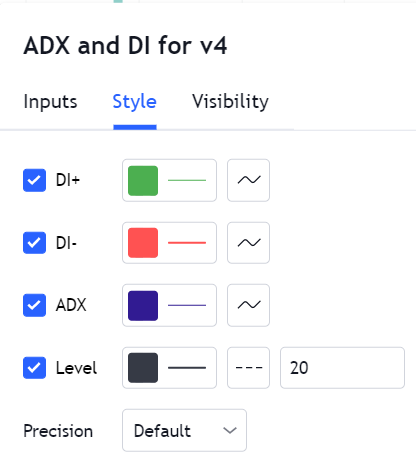
@Rishikesh_ADX
More from Swapnil Kommawar
How I trade monthly short strangles for regular income
A thread 🧵🧵
Retweet 🔃🔃 for max reach
👉Short strangle means,
Selling OTM call option and Selling OTM put option
Here is a detailed thread on short strangle
👉Generally, this strategy gives good returns when market is sideways but most trader get wrong entries and wrong exist
👉Ahead of major event option price will increase because of uncertainty. We have to take advantage of that
👉As the VIX is the derivative of option price, we have to check this parameter first
When VIX is >20, it is the right opportunity to deploy short strangle
👉If we look at the weekly and monthly candles of nifty, it is easier to identify which strikes to choose
Entry conditions:
👉VIX >20
👉Choose the strikes which are 6% above and below of nifty in next month contracts
👉Combined premium should be in the range of 160-170
👉Next month contracts should be taken at the mid of current month
A thread 🧵🧵
Retweet 🔃🔃 for max reach
👉Short strangle means,
Selling OTM call option and Selling OTM put option
Here is a detailed thread on short strangle
NEUTRAL STRATEGIES
— Swapnil Kommawar (@KommawarSwapnil) August 5, 2022
If market is sideways, These strategies can be deployed
Retweet for max reach!
A Thread \U0001f9f5\U0001f9f5\U0001f9f5
👉Generally, this strategy gives good returns when market is sideways but most trader get wrong entries and wrong exist
👉Ahead of major event option price will increase because of uncertainty. We have to take advantage of that
👉As the VIX is the derivative of option price, we have to check this parameter first
When VIX is >20, it is the right opportunity to deploy short strangle
👉If we look at the weekly and monthly candles of nifty, it is easier to identify which strikes to choose
Entry conditions:
👉VIX >20
👉Choose the strikes which are 6% above and below of nifty in next month contracts
👉Combined premium should be in the range of 160-170
👉Next month contracts should be taken at the mid of current month
Generally, VWAP is used to know the strength in a buying or selling. VWAP means VOLUME WEIGHTED AVERAGE PIRCE
A thread 🧵🧵🧵🧵🧵
Retweet/like for maximum reach
👉when price starts rising it would be pulled back to VWAP line. Then buyers would again rush in to buy the stock taking price higher.
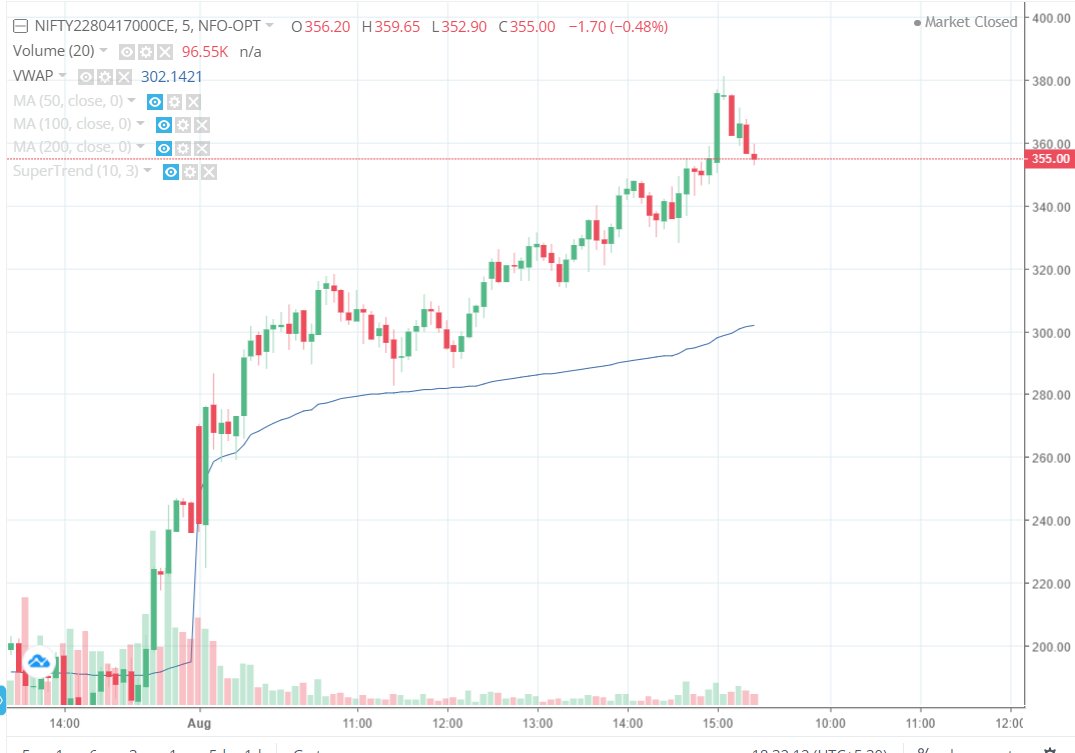
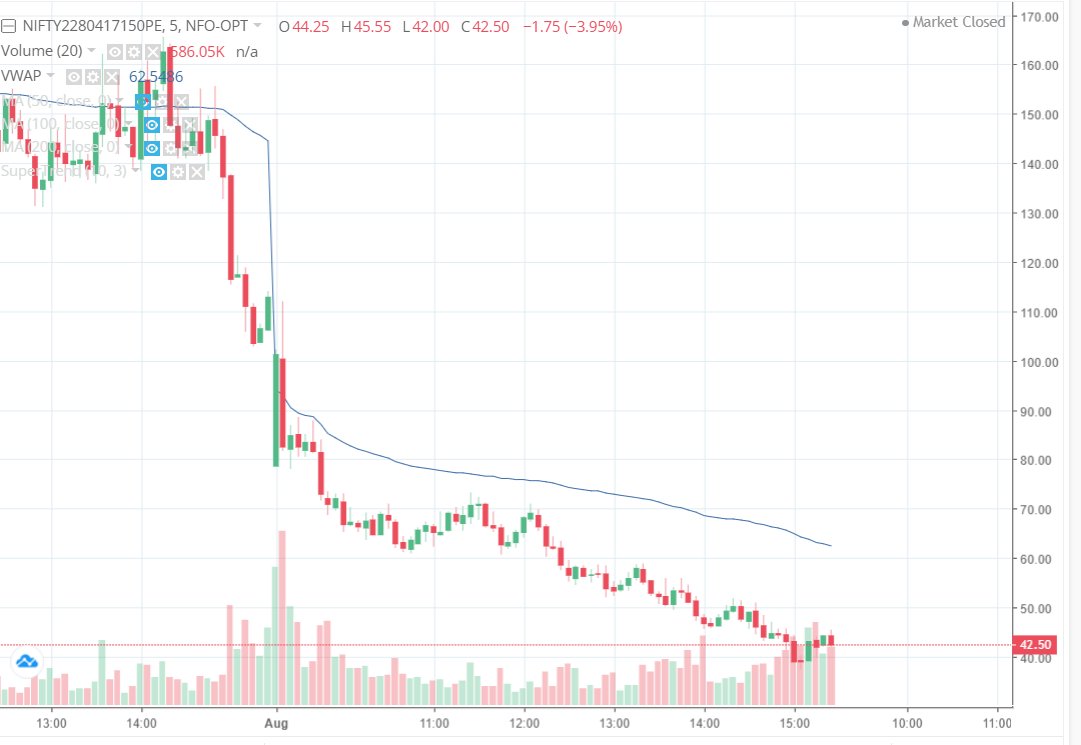
👉If we compare the CALL and PUT charts, we can identify the correct entry. On trending days VWAP acts as support/resistance.
👉If market is trending UPSIDE, VWAP acts as support in CALL option charts of ATM STRIKES and same VWAP acts as RESISTANCE in PUT option charts of ATM STRIKES
(Use VWAP on 5 minutes chart on OPTION CHARTS)
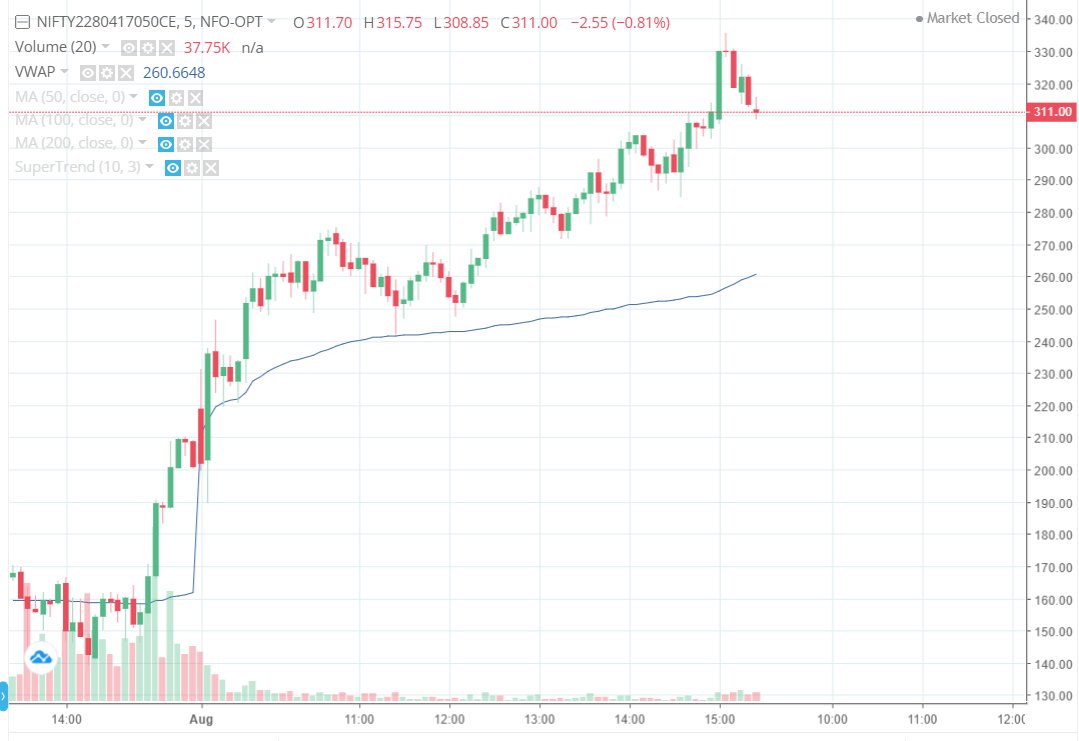
https://t.co/TLmAiypV45
👉If market is trending DOWNSIDE, VWAP acts as support in PUT option charts of ATM STRIKES and same VWAP acts as RESISTANCE in CALL option charts of ATM STRIKE
A thread 🧵🧵🧵🧵🧵
Retweet/like for maximum reach
👉when price starts rising it would be pulled back to VWAP line. Then buyers would again rush in to buy the stock taking price higher.
👉If we compare the CALL and PUT charts, we can identify the correct entry. On trending days VWAP acts as support/resistance.
👉If market is trending UPSIDE, VWAP acts as support in CALL option charts of ATM STRIKES and same VWAP acts as RESISTANCE in PUT option charts of ATM STRIKES
(Use VWAP on 5 minutes chart on OPTION CHARTS)
https://t.co/TLmAiypV45
👉If market is trending DOWNSIDE, VWAP acts as support in PUT option charts of ATM STRIKES and same VWAP acts as RESISTANCE in CALL option charts of ATM STRIKE


More from Screener




On the occasion of youtube 20k and Twitter 70k members
A small tribute/gift to members
Screeners
technical screeners - intraday and positional both
before proceeding - i have helped you , can i ask you so that it can help someone else too
thank you
positional one
run - find #stock - draw chart - find levels
1- Stocks closing daily 2% up from 5 days
https://t.co/gTZrYY3Nht
2- Weekly breakout
https://t.co/1f4ahEolYB
3- Breakouts in short term
https://t.co/BI4h0CdgO2
4- Bullish from last 5
intraday screeners
5- 15 minute Stock Breakouts
https://t.co/9eAo82iuNv
6- Intraday Buying seen in the past 15 minutes
https://t.co/XqAJKhLB5G
7- Stocks trading near day's high on 5 min chart with volume BO intraday
https://t.co/flHmm6QXmo
Thank you
A small tribute/gift to members
Screeners
technical screeners - intraday and positional both
before proceeding - i have helped you , can i ask you so that it can help someone else too
thank you
positional one
run - find #stock - draw chart - find levels
1- Stocks closing daily 2% up from 5 days
https://t.co/gTZrYY3Nht
2- Weekly breakout
https://t.co/1f4ahEolYB
3- Breakouts in short term
https://t.co/BI4h0CdgO2
4- Bullish from last 5
intraday screeners
5- 15 minute Stock Breakouts
https://t.co/9eAo82iuNv
6- Intraday Buying seen in the past 15 minutes
https://t.co/XqAJKhLB5G
7- Stocks trading near day's high on 5 min chart with volume BO intraday
https://t.co/flHmm6QXmo
Thank you

You May Also Like


1/OK, data mystery time.
This New York Times feature shows China with a Gini Index of less than 30, which would make it more equal than Canada, France, or the Netherlands. https://t.co/g3Sv6DZTDE
That's weird. Income inequality in China is legendary.
Let's check this number.
2/The New York Times cites the World Bank's recent report, "Fair Progress? Economic Mobility across Generations Around the World".
The report is available here:
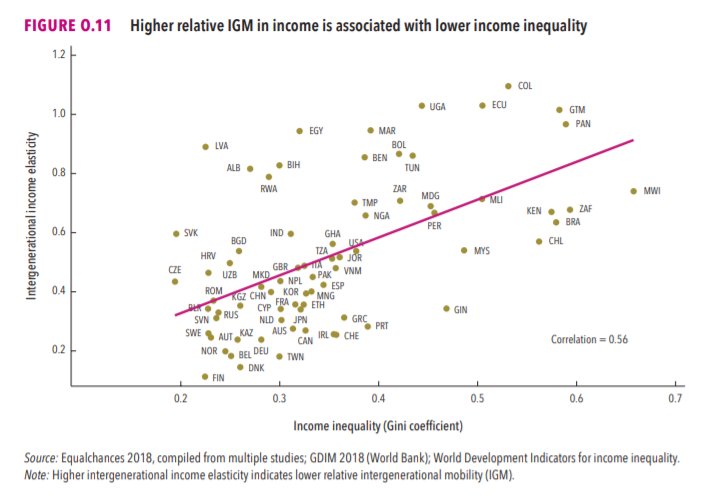
3/The World Bank report has a graph in which it appears to show the same value for China's Gini - under 0.3.
The graph cites the World Development Indicators as its source for the income inequality data.
4/The World Development Indicators are available at the World Bank's website.
Here's the Gini index: https://t.co/MvylQzpX6A
It looks as if the latest estimate for China's Gini is 42.2.
That estimate is from 2012.
5/A Gini of 42.2 would put China in the same neighborhood as the U.S., whose Gini was estimated at 41 in 2013.
I can't find the <30 number anywhere. The only other estimate in the tables for China is from 2008, when it was estimated at 42.8.
This New York Times feature shows China with a Gini Index of less than 30, which would make it more equal than Canada, France, or the Netherlands. https://t.co/g3Sv6DZTDE
That's weird. Income inequality in China is legendary.
Let's check this number.
2/The New York Times cites the World Bank's recent report, "Fair Progress? Economic Mobility across Generations Around the World".
The report is available here:
3/The World Bank report has a graph in which it appears to show the same value for China's Gini - under 0.3.
The graph cites the World Development Indicators as its source for the income inequality data.
4/The World Development Indicators are available at the World Bank's website.
Here's the Gini index: https://t.co/MvylQzpX6A
It looks as if the latest estimate for China's Gini is 42.2.
That estimate is from 2012.
5/A Gini of 42.2 would put China in the same neighborhood as the U.S., whose Gini was estimated at 41 in 2013.
I can't find the <30 number anywhere. The only other estimate in the tables for China is from 2008, when it was estimated at 42.8.