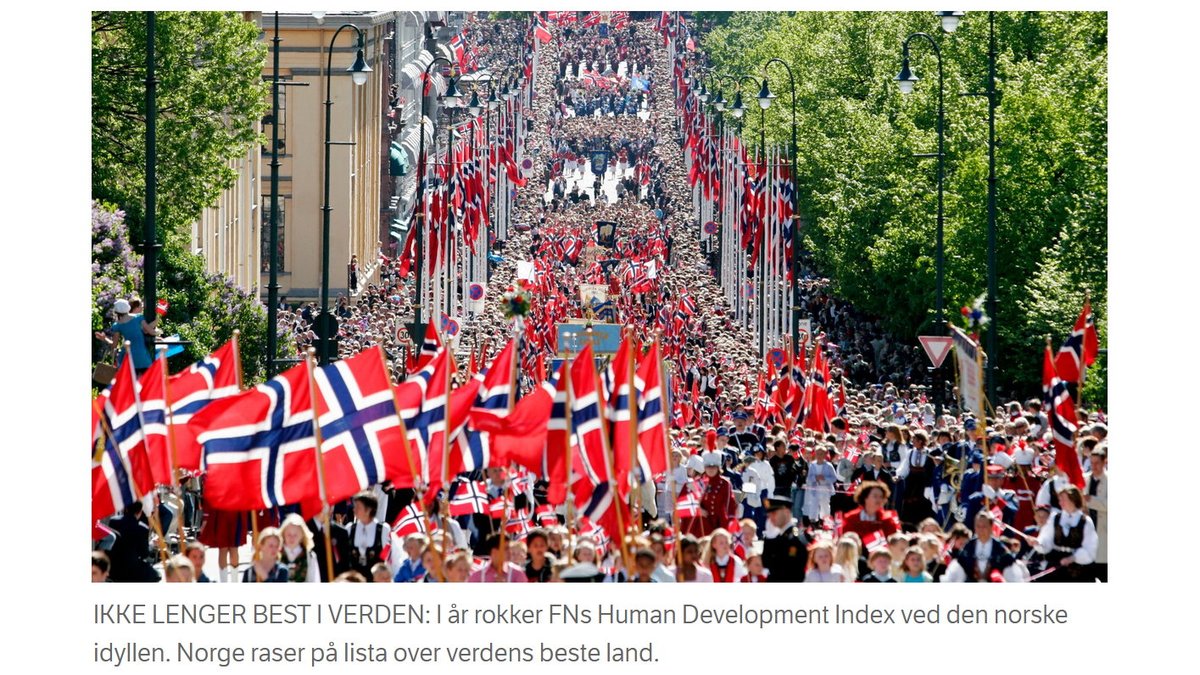
"NO LONGER BEST IN THE WORLD"
UNEP's new Human Development Index includes a new (separate) index: Planetary pressures-adjusted HDI (PHDI). News in Norway is that its position drops from #1 to #16 because of this, while Ireland rises from #2 to #1.
Why?

https://t.co/aVraIEzRfh

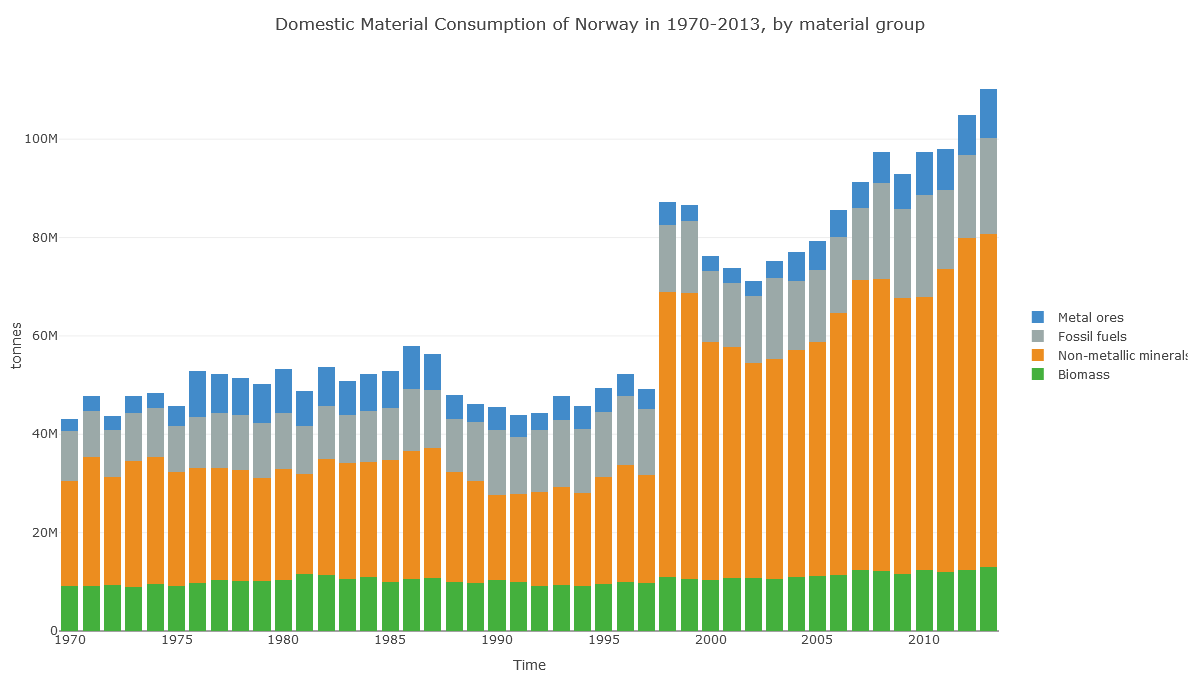
Check out Norway's 'Domestic Material Consumption'. Fossil fuels are no different here to Ireland's. What's different is this huge 'non-metallic minerals' category.
(Note also the jump in 1998, suggesting data problems.)
https://t.co/5QvzONbqmN
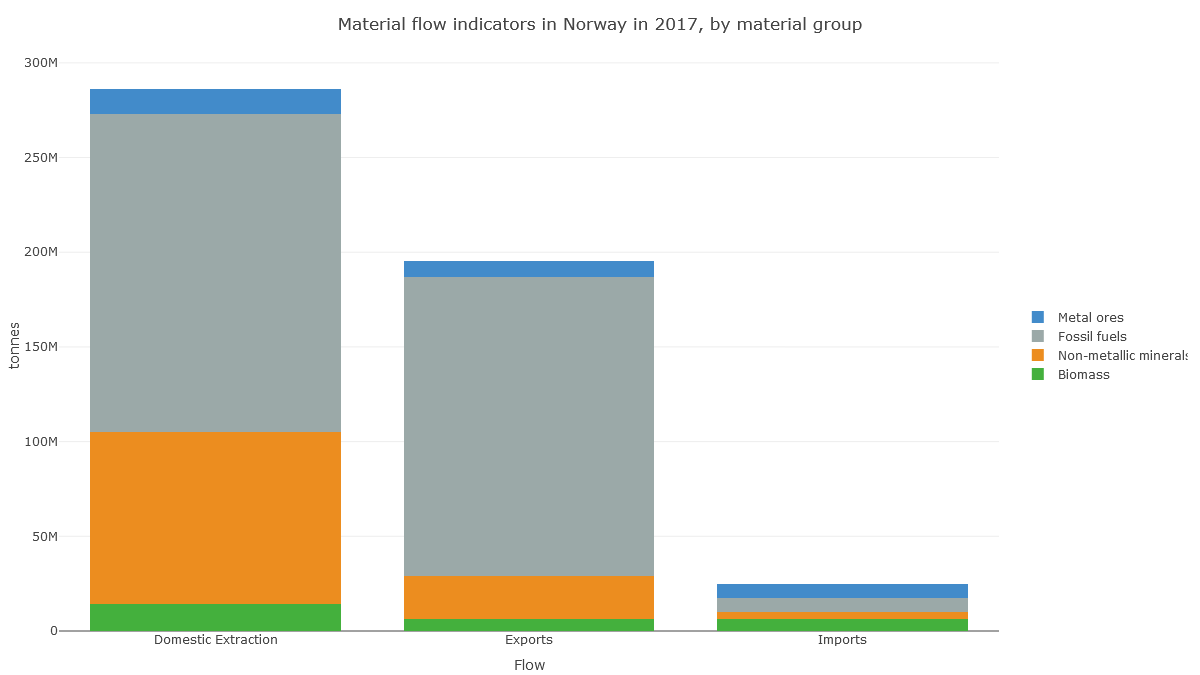
In Norway's case, it looks like the apparent consumption equation (production+imports-exports) for non-metal minerals is dominated by production: extraction of material in Norway.
https://t.co/5QvzONbqmN
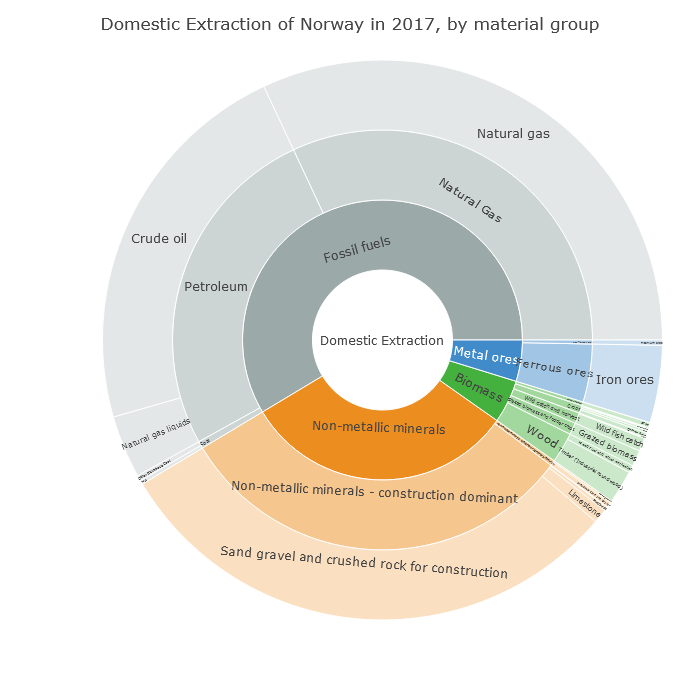
And here we see that this production of non-metallic minerals is sand, gravel and crushed rock for construction. So it's about Norway's geology.
https://t.co/y6rqWmFVWc
Norway drops 15 places on the PHDI list not because of its CO₂ emissions (fairly high at 41st highest in the world per capita), but because of its geology, because it shifts a lot of rock whenever it builds anything.
What do you think? Is the amount of rock and sand shifted around a good indicator of a country's contribution to "dangerous planetary change"?
Here's the story on NRK's website (in Norwegian):
https://t.co/XqIExzKBoO
PS. I spent less than an hour looking at this. If anyone has more detailed data/understanding, please chip in.
Here's a direct link to the table in the report showing the PHDI. Ireland's index for CO₂ is 0.884, while Norway's is 0.881, almost the same. For material footprint Ireland is 0.859, Norway 0.752. It's the material footprint that drags Norway down.
https://t.co/J6YOpT6MgO
It's always difficult for this sort of analysis using global datasets. You can't check every country. The report says Norway has high use of nitrogen fertiliser, but it calculates this as the "tonnes per 1,000 hectares of cropland". A problem?
https://t.co/ahqifXDMGY
Seems to be a problem, yes, because Norway has very little cropland (again with those rocks) and about half of the nitrogen fertiliser is spread on pastures. Dividing only by cropland will greatly increase the apparent breach of this planetary boundary.
https://t.co/amTyCbNHY8
Norway also transgresses because it hasn't increased its forest area by 7.5% since 1990. As if it could? I see Iceland is off the hook on this one.
A global goal of increasing forest area by 0.25%/yr is good, but there are country-specific factors to consider.

More from Science

JUST ONE PERSON—UK 🇬🇧 scientists think one immunocompromised person who cleared virus slowly & only partially wiped out an infection, leaving behind genetically-hardier viruses that rebound & learn how to survive better. That’s likely how #B117 started. 🧵 https://t.co/bMMjM8Hiuz


2) The leading hypothesis is that the new variant evolved within just one person, chronically infected with the virus for so long it was able to evolve into a new, more infectious form.

same thing happened in Boston in another immunocompromised person that was sick for 155 days.

3) What happened in Boston with one 45 year old man who was highly infectious for 155 days straight before he died... is exactly what scientists think happened in Kent, England that gave rise to #B117.


4) Doctors were shocked to find virus has evolved many different forms inside of this one immunocompromised man. 20 new mutations in one virus, akin to the #B117. This is possibly how #B1351 in South Africa 🇿🇦 and #P1 in Brazil 🇧🇷 also evolved.


5) “On its own, the appearance of a new variant in genomic databases doesn’t tell us much. “That’s just one genome amongst thousands every week. It wouldn’t necessarily stick out,” says Oliver Pybus, a professor of evolution and infectious disease at Oxford.

You May Also Like

Trading view scanner process -

1 - open trading view in your browser and select stock scanner in left corner down side .

2 - touch the percentage% gain change ( and u can see higest gainer of today)


3. Then, start with 6% gainer to 20% gainer and look charts of everyone in daily Timeframe . (For fno selection u can choose 1% to 4% )

4. Then manually select the stocks which are going to give all time high BO or 52 high BO or already given.

5. U can also select those stocks which are going to give range breakout or already given range BO

6 . If in 15 min chart📊 any stock sustaing near BO zone or after BO then select it on your watchlist

7 . Now next day if any stock show momentum u can take trade in it with RM

This looks very easy & simple but,

U will amazed to see it's result if you follow proper risk management.

I did 4x my capital by trading in only momentum stocks.

I will keep sharing such learning thread 🧵 for you 🙏💞🙏

Keep learning / keep sharing 🙏
@AdityaTodmal