
1 new chart everyday, it could be from any space ~ equities / commodities / crypto / forex / bonds , etc
Will try to do it daily 🙏💪
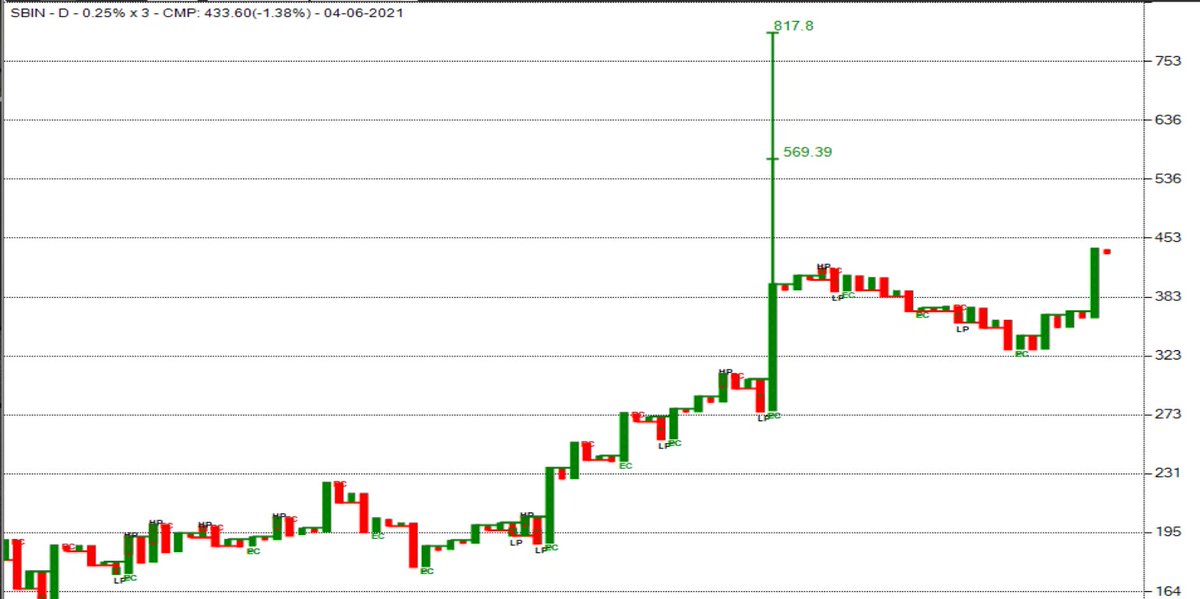
Here's the first one 👇
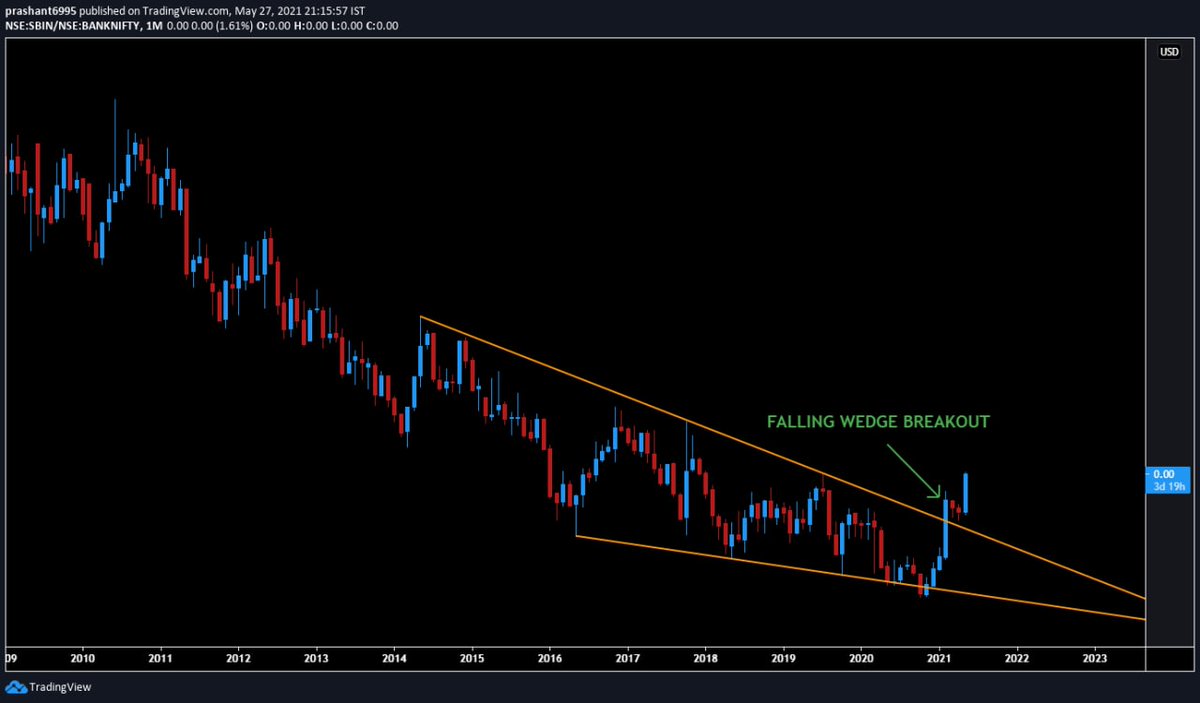
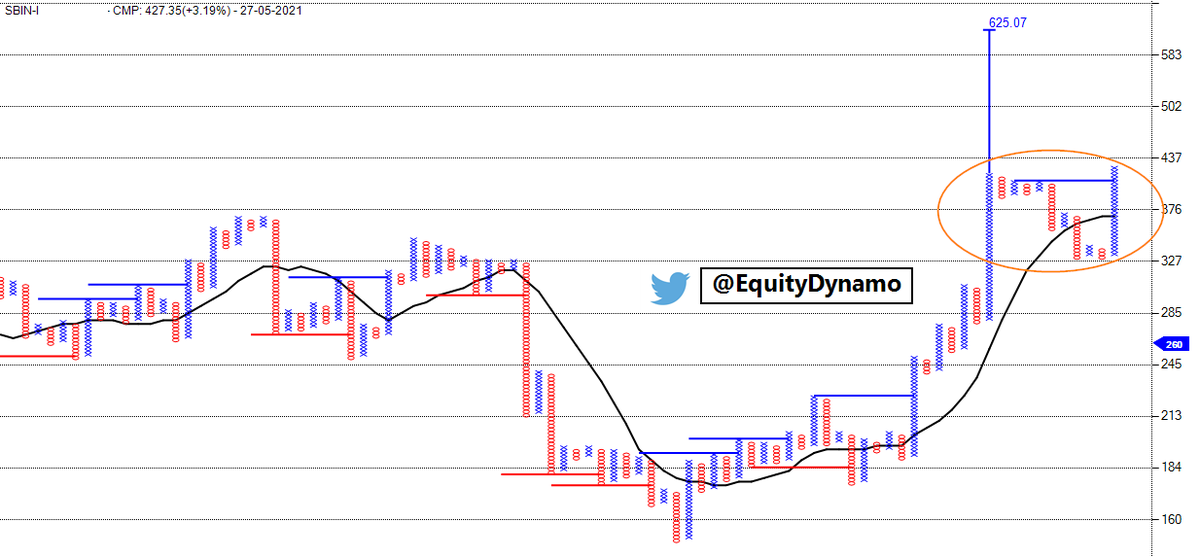
SBI vs BankNifty
Ratio chart has given monthly breakout implying SBI could outperform BN in coming months.
#PB365
More from Prashant Bhansali
5 waves from 1998 bottom
5 waves from 2015 bottom
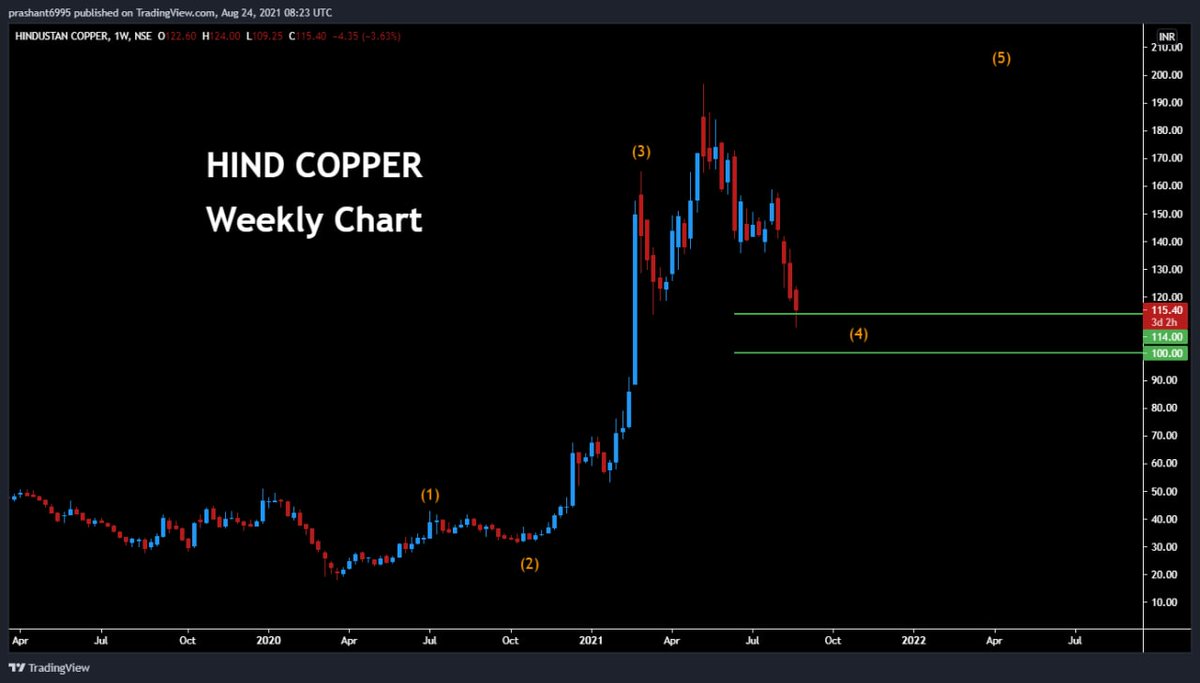
5 waves from 2020 bottom
All on verge of completion on weekly and monthly charts
**3288** the level above which if it moves, need to re-evaluate analysis
IT'S ALL ABOUT CYCLES
#ElliottWaves https://t.co/gqaP855BxM
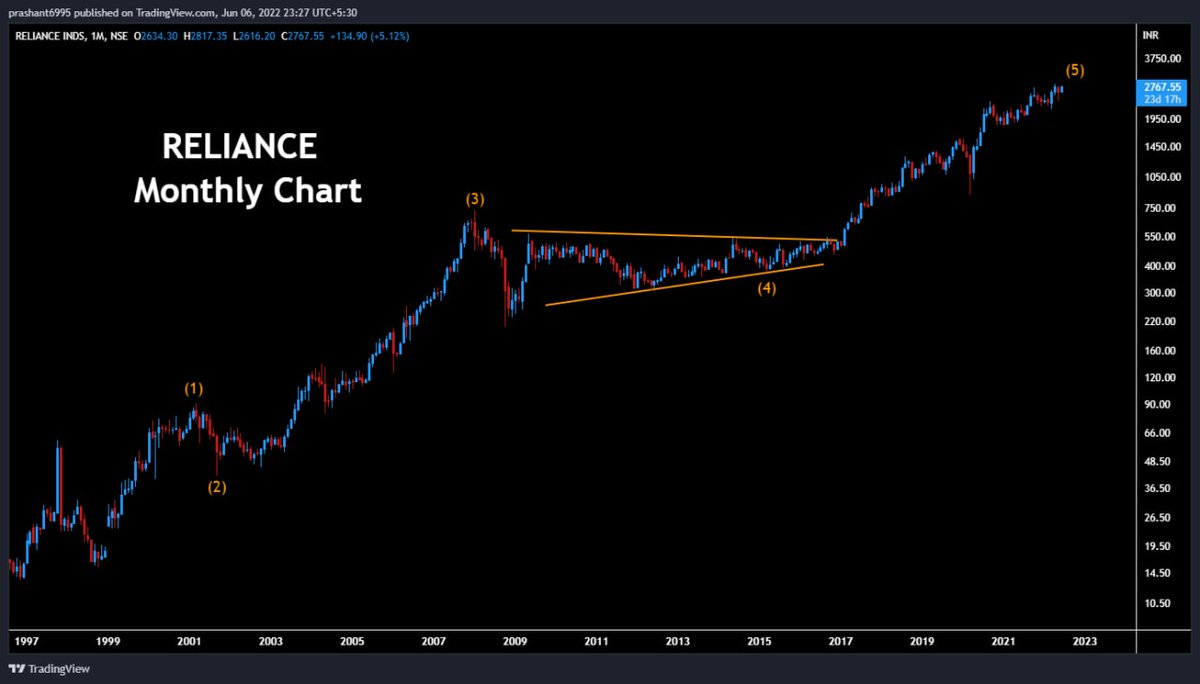
#Reliance - Near completion of 5 waves from bottom in 98. Period of 2008-2015 was a clear triangle (wave 4)
— Harsh / \ud5c8\uc26c (@_Harsh_Mehta_) June 6, 2022
Some upside still possible but every rise calls for caution. https://t.co/9xjWbR1wn4 pic.twitter.com/gkz9WiUS2Y


More from Sbin


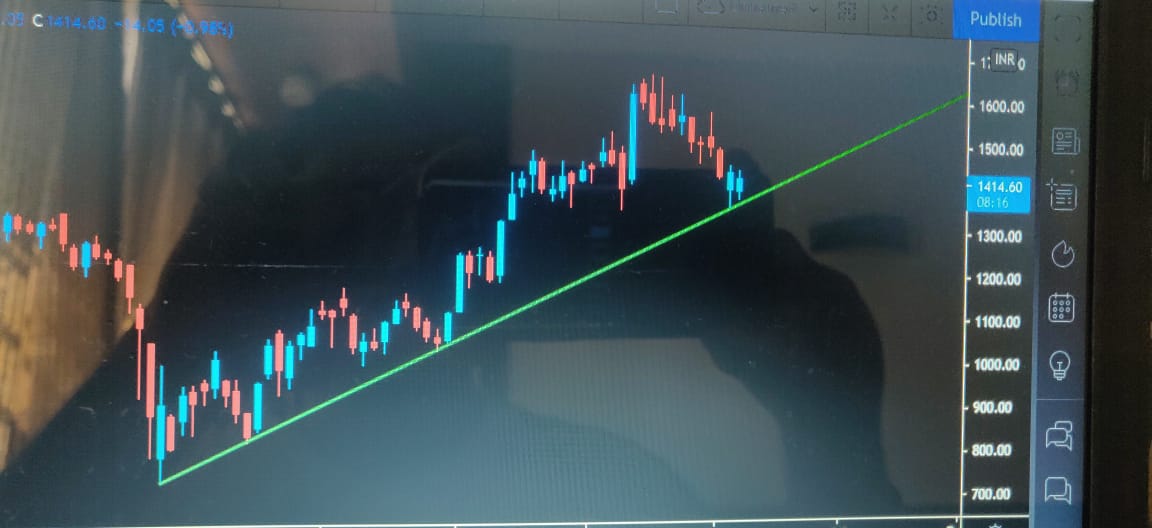
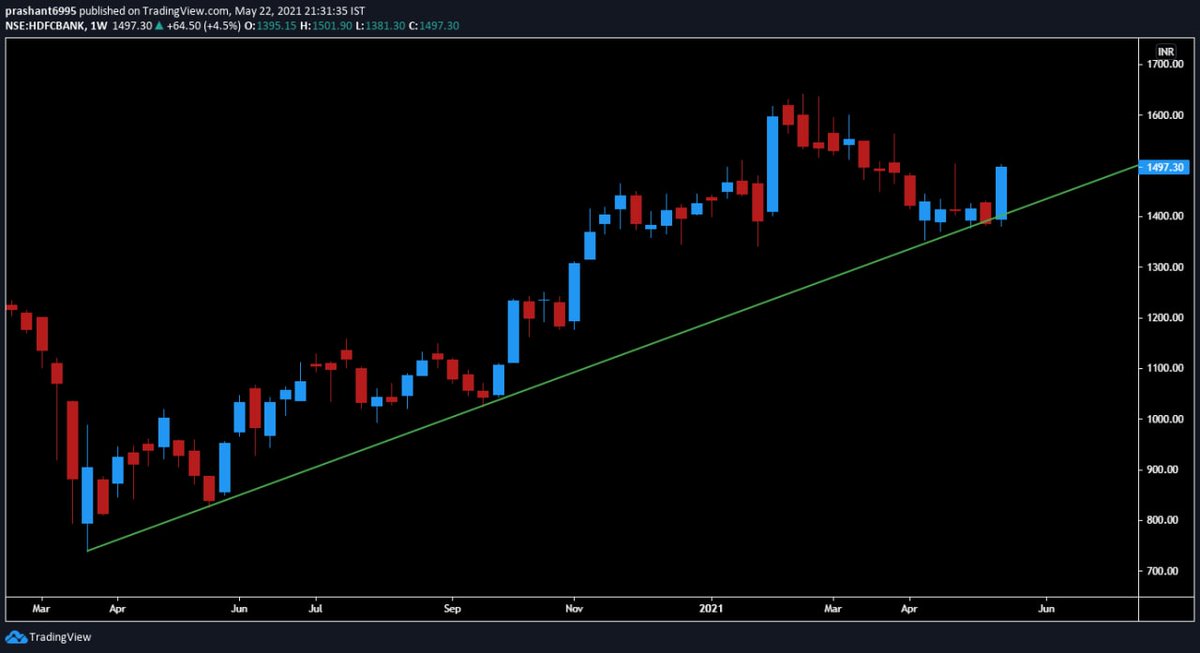
#FnOstock #SBIN has completed a 9 month time correction towards the primary trend line & is all set to head higher from here.
— Trendline Investor (@dmdsplyinvestor) July 11, 2022
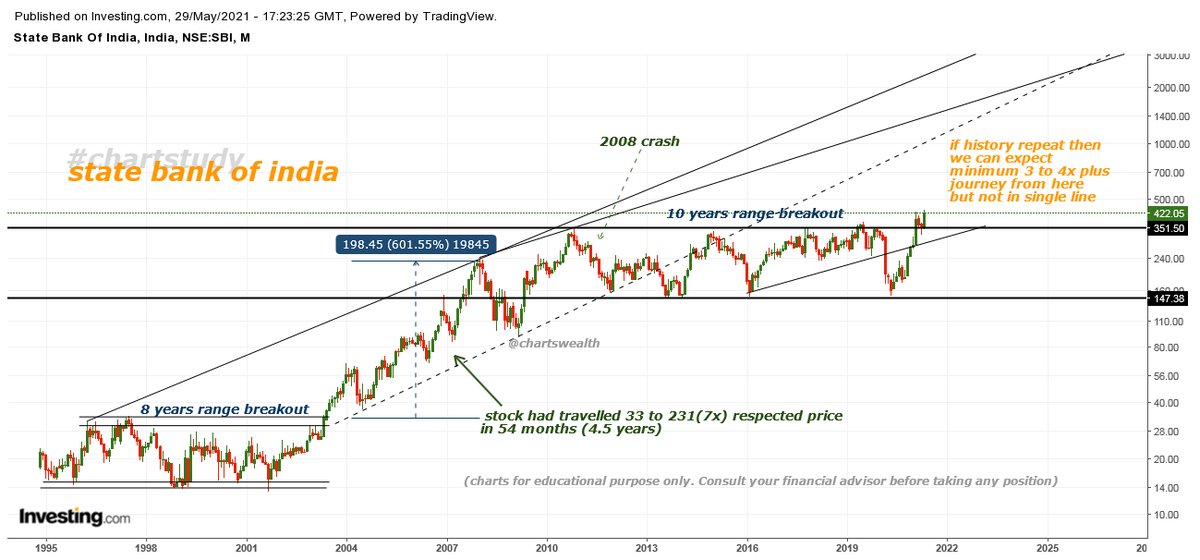
This could also be a #SIP stock considering it broke out from a decade long consolidation in Feb'21.
Might continue to outperform #Nifty & #Banknifty pic.twitter.com/mYk4exvOn7


You May Also Like


Covering one of the most unique set ups: Extended moves & Reversal plays
Time for a 🧵 to learn the above from @iManasArora
What qualifies for an extended move?
30-40% move in just 5-6 days is one example of extended move
How Manas used this info to book
The stock exploded & went up as much as 63% from my price.
— Manas Arora (@iManasArora) June 22, 2020
Closed my position entirely today!#BroTip pic.twitter.com/CRbQh3kvMM
Post that the plight of the
What an extended (away from averages) move looks like!!
— Manas Arora (@iManasArora) June 24, 2020
If you don't learn to sell into strength, be ready to give away the majority of your gains.#GLENMARK pic.twitter.com/5DsRTUaGO2
Example 2: Booking profits when the stock is extended from 10WMA
10WMA =
#HIKAL
— Manas Arora (@iManasArora) July 2, 2021
Closed remaining at 560
Reason: It is 40+% from 10wma. Super extended
Total revenue: 11R * 0.25 (size) = 2.75% on portfolio
Trade closed pic.twitter.com/YDDvhz8swT
Another hack to identify extended move in a stock:
Too many green days!
Read
When you see 15 green weeks in a row, that's the end of the move. *Extended*
— Manas Arora (@iManasArora) August 26, 2019
Simple price action analysis.#Seamecltd https://t.co/gR9xzgeb9K

Why is this the most powerful question you can ask when attempting to reach an agreement with another human being or organization?
A thread, co-written by @deanmbrody:
Next level tactic when closing a sale, candidate, or investment:
— Erik Torenberg (@eriktorenberg) February 27, 2018
Ask: \u201cWhat needs to be true for you to be all in?\u201d
You'll usually get an explicit answer that you might not get otherwise. It also holds them accountable once the thing they need becomes true.
2/ First, “X” could be lots of things. Examples: What would need to be true for you to
- “Feel it's in our best interest for me to be CMO"
- “Feel that we’re in a good place as a company”
- “Feel that we’re on the same page”
- “Feel that we both got what we wanted from this deal
3/ Normally, we aren’t that direct. Example from startup/VC land:
Founders leave VC meetings thinking that every VC will invest, but they rarely do.
Worse over, the founders don’t know what they need to do in order to be fundable.
4/ So why should you ask the magic Q?
To get clarity.
You want to know where you stand, and what it takes to get what you want in a way that also gets them what they want.
It also holds them (mentally) accountable once the thing they need becomes true.
5/ Staying in the context of soliciting investors, the question is “what would need to be true for you to want to invest (or partner with us on this journey, etc)?”
Multiple responses to this question are likely to deliver a positive result.
