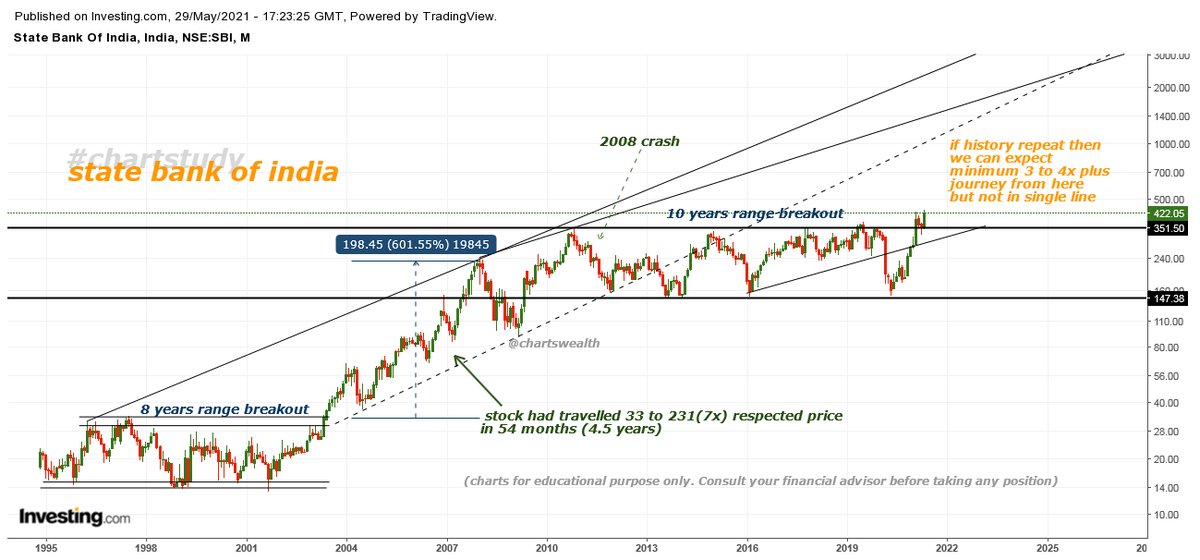
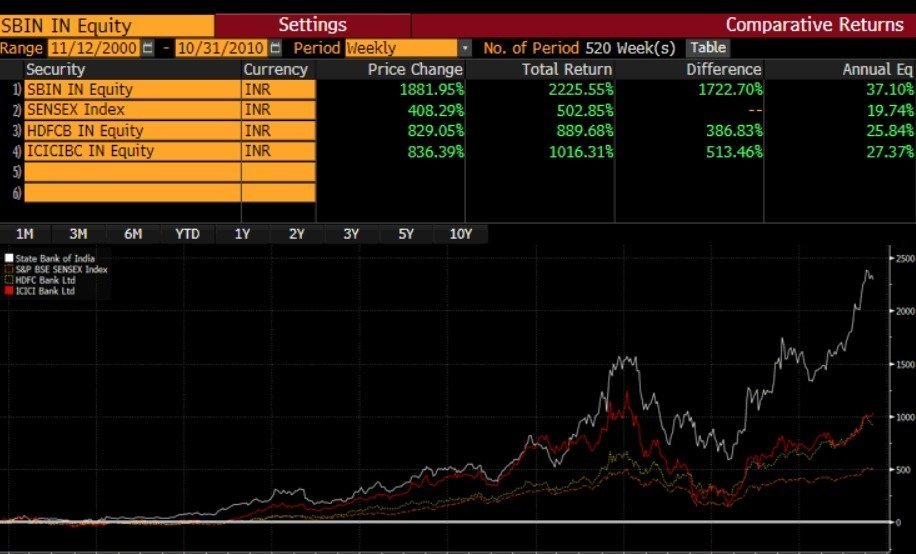
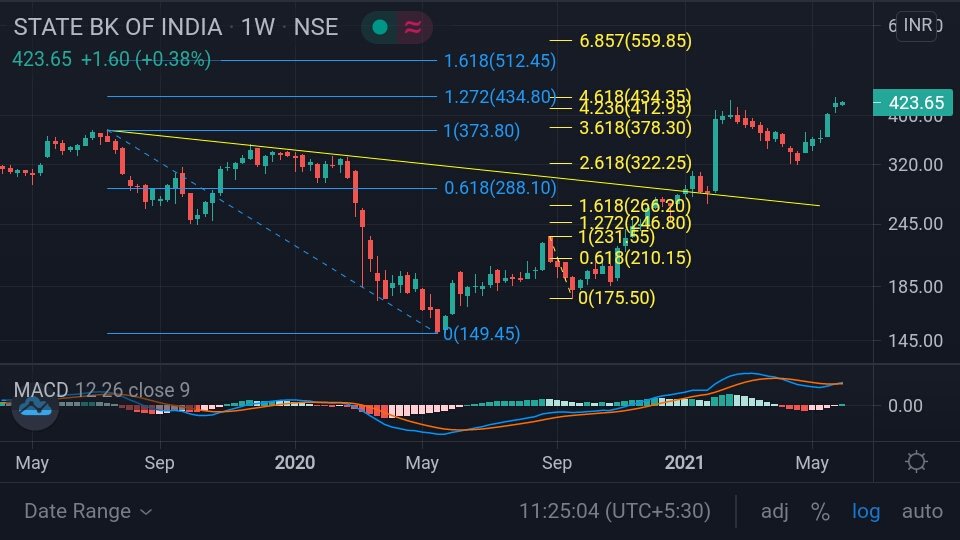
#sbin #monthly #chartstudy
STATE BANK OF INDIA
(chart study)
-details on chart
@shivaji_1983
More from Rajeev
(Updated Chart)
➡️ stock testing breakout zone (pullback)
#gsfc #stocks https://t.co/r9P951sO8v
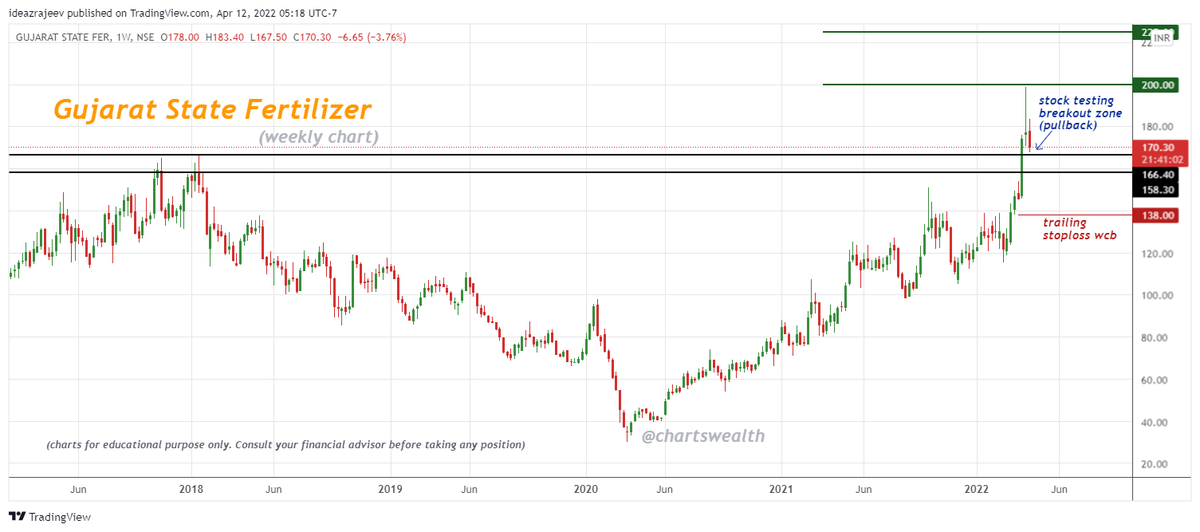
Gujarat State Fertilizer
— Rajeev (@chartswealth) April 2, 2022
(Weekly Chart)
\u27a1\ufe0f CMP : 174.05
\u27a1\ufe0f 4 Years breakout
\u27a1\ufe0f Possible upside : 200-225+
\u27a1\ufe0f Trailing Stoploss 138 wcb
\u27a1\ufe0f Chart for educational purposes only#gsfc #stockstowatch #investing #StockMarketindia #stockstobuy #stocks https://t.co/yDuZDIwVjn pic.twitter.com/LBHwPKaGOc

More from Sbin


#SBILife
Probable #SuperPattern Bullish
@shivaji_1983 https://t.co/8e8YvbpWW7

Multi Chart Scanner #Nifty500
— Vithal (@srvithal388) August 13, 2022
Box 1% EOD
Price Scanner - Probable Super Pattern stocks
Relative Strength Scanner - Price above MA - Moving Average and ST - Super Trend in Relative Strength
Denominator - #Nifty500 pic.twitter.com/FFIRInUGIs


You May Also Like

(I am forced to do this due to continuous hounding of Sikh Extremists since yesterday)
Rani Jindan Kaur, wife of Maharaja Ranjit Singh had illegitimate relations with Lal Singh (PM of Ranjit Singh). Along with Lal Singh, she attacked Jammu, burnt - https://t.co/EfjAq59AyI

Tomorrow again same thing happens bcoz fudus like you are creating a narrative oh Khalistan. when farmers are asking MSP. (RSS ki tatti khane wale Kerni sena ke kutte).
— Ancient Economist (@_stock_tips) December 5, 2020
U kill sikhs in 1984 just politics. To BC low IQ fudu Saale entire history was politics.
Hindu villages of Jasrota, caused rebellion in Jammu, attacked Kishtwar.
Ancestors of Raja Ranjit Singh, The Sansi Tribe used to give daughters as concubines to Jahangir.

The Ludhiana Political Agency (Later NW Fronties Prov) was formed by less than 4000 British soldiers who advanced from Delhi and reached Ludhiana, receiving submissions of all sikh chiefs along the way. The submission of the troops of Raja of Lahore (Ranjit Singh) at Ambala.
Dabistan a contemporary book on Sikh History tells us that Guru Hargobind broke Naina devi Idol Same source describes Guru Hargobind serving a eunuch
YarKhan. (ref was proudly shared by a sikh on twitter)
Gobind Singh followed Bahadur Shah to Deccan to fight for him.

In Zafarnama, Guru Gobind Singh states that the reason he was in conflict with the Hill Rajas was that while they were worshiping idols, while he was an idol-breaker.
And idiot Hindus place him along Maharana, Prithviraj and Shivaji as saviours of Dharma.