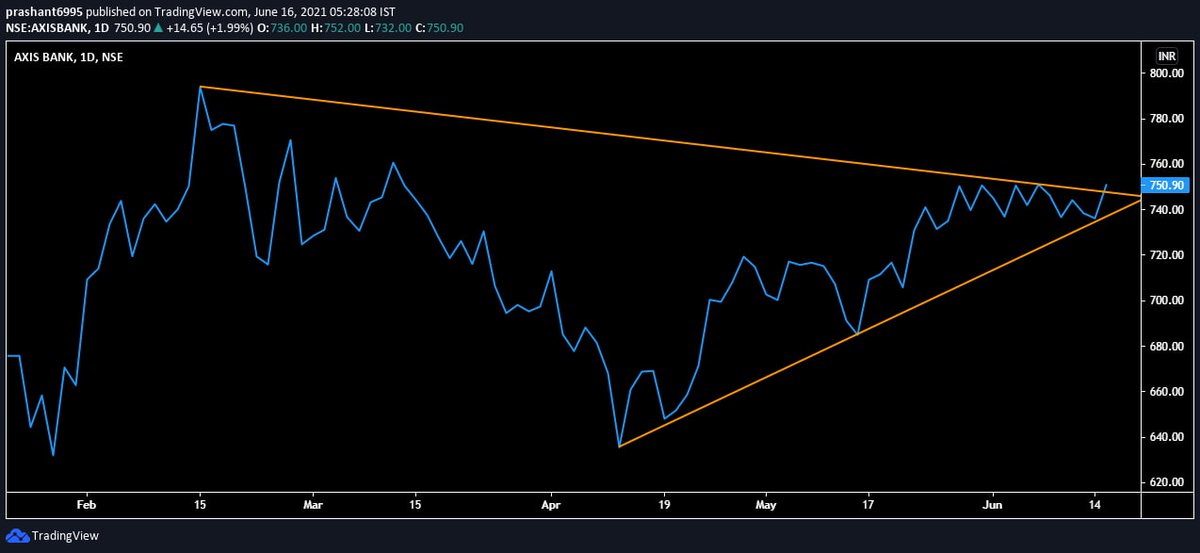
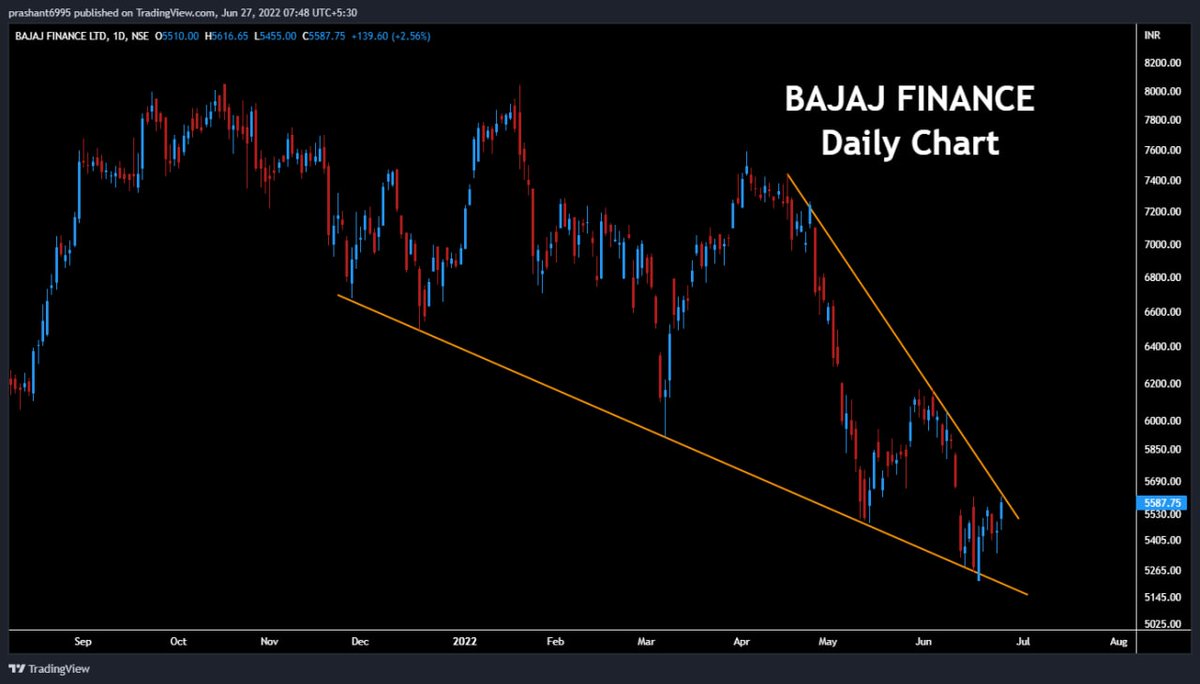
Seeing a lot of people making triangles with just 2-3 touchpoints offlate
An ideal triangle shall have at the minimum 5 touchpoints in order to give a good trending move post that
Here are few examples 👇

More from Prashant Bhansali
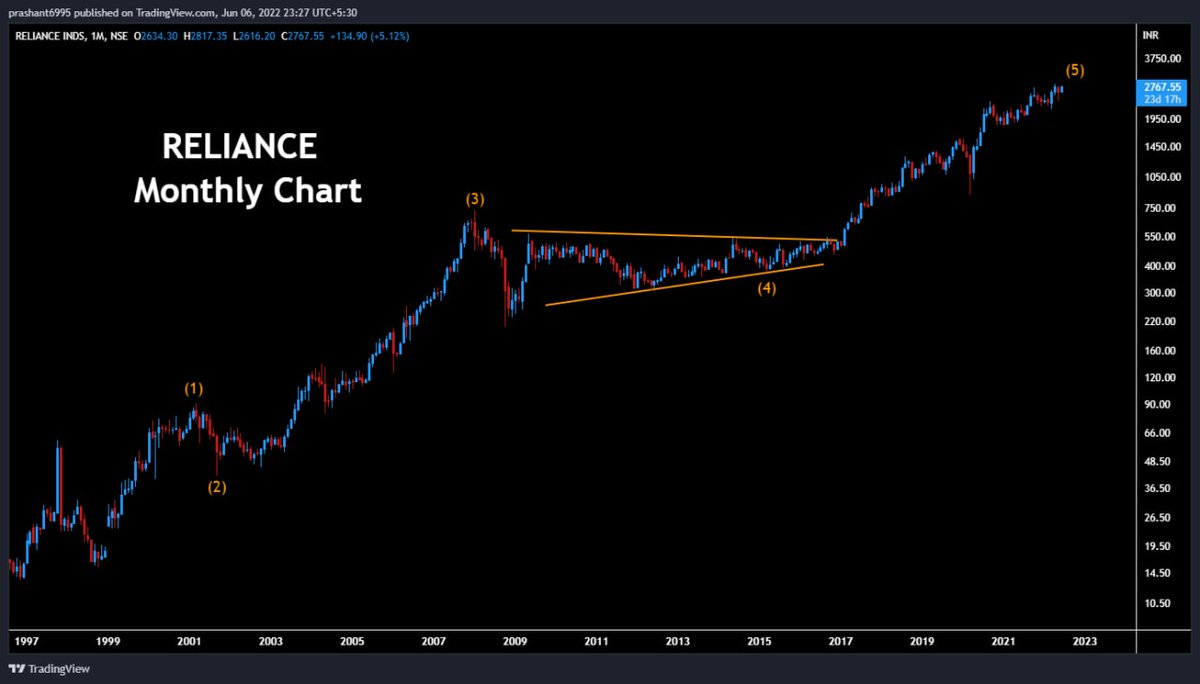
Same view on #Reliance 👍
5 waves from 1998 bottom
5 waves from 2015 bottom
5 waves from 2020 bottom
All on verge of completion on weekly and monthly charts
**3288** the level above which if it moves, need to re-evaluate analysis
IT'S ALL ABOUT CYCLES
#ElliottWaves https://t.co/gqaP855BxM
5 waves from 1998 bottom
5 waves from 2015 bottom
5 waves from 2020 bottom
All on verge of completion on weekly and monthly charts
**3288** the level above which if it moves, need to re-evaluate analysis
IT'S ALL ABOUT CYCLES
#ElliottWaves https://t.co/gqaP855BxM
#Reliance - Near completion of 5 waves from bottom in 98. Period of 2008-2015 was a clear triangle (wave 4)
— Harsh / \ud5c8\uc26c (@_Harsh_Mehta_) June 6, 2022
Some upside still possible but every rise calls for caution. https://t.co/9xjWbR1wn4 pic.twitter.com/gkz9WiUS2Y
Many have asked how to plot ratio charts on trading view, here is an example , suppose you want to see Maruti/Nifty auto:
1. Type the code of these two scripts exactly as shown in TV without any space and use NSE before it
NSE:MARUTI/NSE:CNXAUTO
2. Press enter
@Digital_Baba
1. Type the code of these two scripts exactly as shown in TV without any space and use NSE before it
NSE:MARUTI/NSE:CNXAUTO
2. Press enter
(10) Ratio chart (daily) of Auto Index/Nifty
— Prashant Bhansali (@prashant280294) June 5, 2021
Taking multiple support at crucial level
Autos could start outperformance over nifty as long the support holds , and more fiercely once resistance breached #PB365 pic.twitter.com/ZRSmtGH1ic
@Digital_Baba