
#SBIN has formed a shooting star candlestick reversal pattern near prior resistance of 521, now for confirmation we need price sustaining below 511 & RSI entering normal zone below 70
If both happens the stock may see a correction from here
#nifty #BankNifty #stocks

More from Techno Prince


More from Sbin

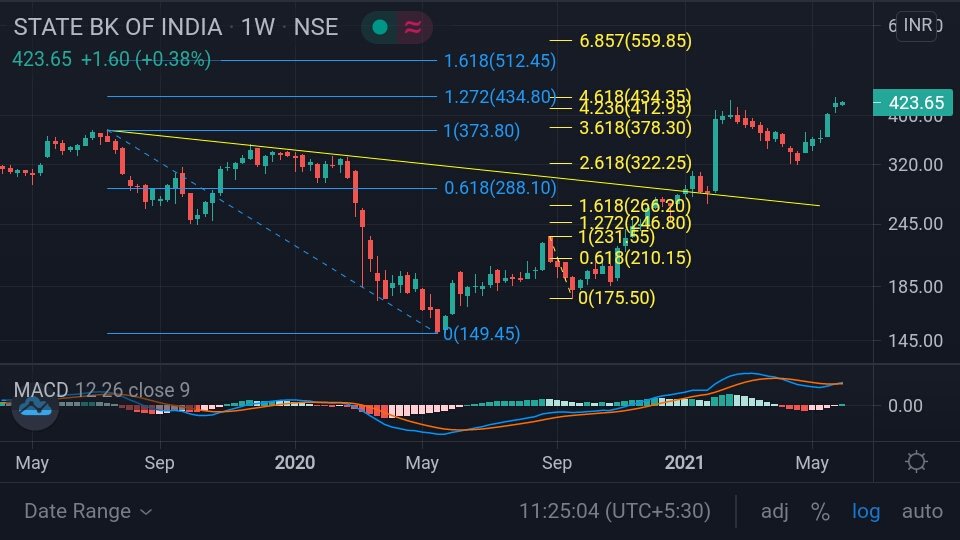

#SBIN
#SBILife
Probable #SuperPattern Bullish
@shivaji_1983 https://t.co/8e8YvbpWW7
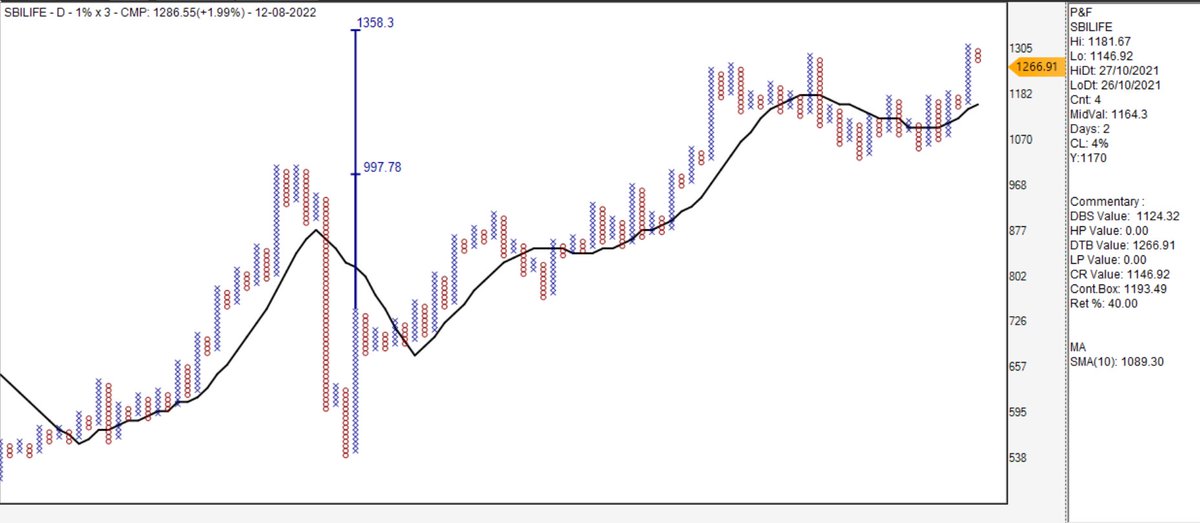
#SBILife
Probable #SuperPattern Bullish
@shivaji_1983 https://t.co/8e8YvbpWW7
Multi Chart Scanner #Nifty500
— Vithal (@srvithal388) August 13, 2022
Box 1% EOD
Price Scanner - Probable Super Pattern stocks
Relative Strength Scanner - Price above MA - Moving Average and ST - Super Trend in Relative Strength
Denominator - #Nifty500 pic.twitter.com/FFIRInUGIs


You May Also Like


✨📱 iOS 12.1 📱✨
🗓 Release date: October 30, 2018
📝 New Emojis: 158
https://t.co/bx8XjhiCiB
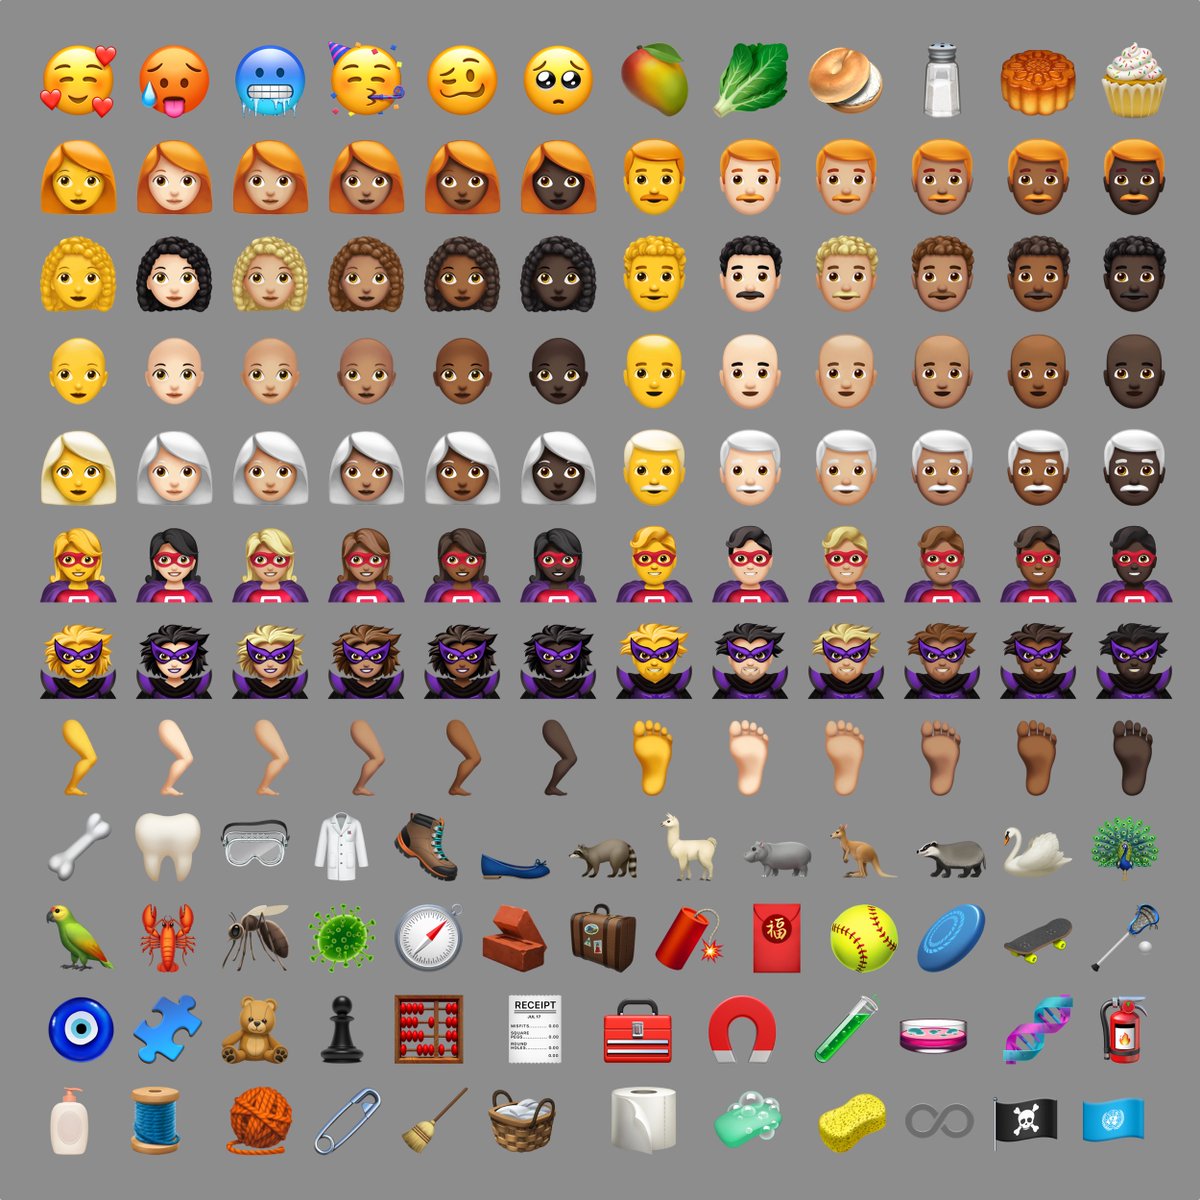
New in iOS 12.1: 🥰 Smiling Face With 3 Hearts https://t.co/6eajdvueip

New in iOS 12.1: 🥵 Hot Face https://t.co/jhTv1elltB

New in iOS 12.1: 🥶 Cold Face https://t.co/EIjyl6yZrF

New in iOS 12.1: 🥳 Partying Face https://t.co/p8FDNEQ3LJ

🗓 Release date: October 30, 2018
📝 New Emojis: 158
https://t.co/bx8XjhiCiB
New in iOS 12.1: 🥰 Smiling Face With 3 Hearts https://t.co/6eajdvueip
New in iOS 12.1: 🥵 Hot Face https://t.co/jhTv1elltB
New in iOS 12.1: 🥶 Cold Face https://t.co/EIjyl6yZrF
New in iOS 12.1: 🥳 Partying Face https://t.co/p8FDNEQ3LJ

MDZS is laden with buddhist references. As a South Asian person, and history buff, it is so interesting to see how Buddhism, which originated from India, migrated, flourished & changed in the context of China. Here's some research (🙏🏼 @starkjeon for CN insight + citations)
1. LWJ’s sword Bichen ‘is likely an abbreviation for the term 躲避红尘 (duǒ bì hóng chén), which can be translated as such: 躲避: shunning or hiding away from 红尘 (worldly affairs; which is a buddhist teaching.) (https://t.co/zF65W3roJe) (abbrev. TWX)
2. Sandu (三 毒), Jiang Cheng’s sword, refers to the three poisons (triviṣa) in Buddhism; desire (kāma-taṇhā), delusion (bhava-taṇhā) and hatred (vibhava-taṇhā).
These 3 poisons represent the roots of craving (tanha) and are the cause of Dukkha (suffering, pain) and thus result in rebirth.
Interesting that MXTX used this name for one of the characters who suffers, arguably, the worst of these three emotions.
3. The Qian kun purse “乾坤袋 (qián kūn dài) – can be called “Heaven and Earth” Pouch. In Buddhism, Maitreya (मैत्रेय) owns this to store items. It was believed that there was a mythical space inside the bag that could absorb the world.” (TWX)
