I've spent months trying to identify how to find a stock that is about to outperform markets...
And, finally I nailed down on this 👇
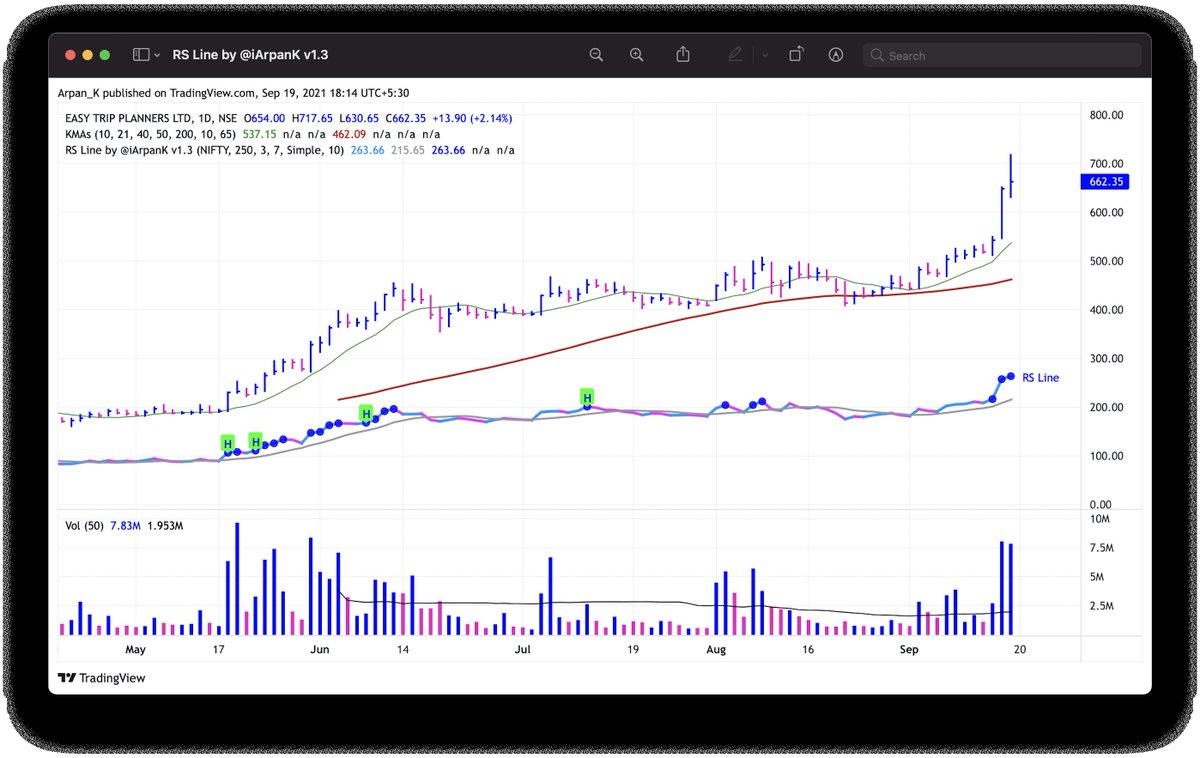
Relative strength!
Here is a simple indicator on Trading view for you!
https://t.co/Iwl5cw6Gv6
RT to help people find outperforming stocks!
More from Trendline Investor
Which one would be the next?
#StocksToBuy https://t.co/zaAfCtOkJ6

I think it is just about time for #broking stocks to \U0001f680!
— Trendline Investor (@dmdsplyinvestor) April 4, 2022
- #AngelOne looks the strongest & near ATH
- #Isec near major trendline support, forming Dojis on weekly
- #Motilalofs near major trendline supports, forming Dojis on monthly
All three low-risk setups!#stockideas pic.twitter.com/xB3Tm9jSou
Here are 6⃣ simple strategies which you can use if you are still struggling to trade cash stocks!
They are very simple yet very effective if you can stick to them🤓
Ready to learn?
Let's go🧵...
1⃣ CCI & Pivot based strategy to ride massive trends in stocks
Don't forget to checkout the fundamental
For 7 yrs I struggled to ride trends..
— Trendline Investor (@dmdsplyinvestor) April 30, 2022
& in 2015-17 when I started learning TA smthng crazy happened..
Here is a simple strategy that helped me..
\u2022 Identify turning points in stocks
\u2022 Find quality stocks
\u2022 Not panic & ride trends
\u2022 Finally make \U0001f4b8
CCI & Pivot Strategy\U0001f9f5.. pic.twitter.com/S0QFx00541
2⃣ Multi-time frame positional strategy based on CCI with
There are 1000s of indicators in Technical Analysis...
— Trendline Investor (@dmdsplyinvestor) May 12, 2022
But you need to MASTER ONLY ONE\U0001f3afto win in markets...
I selected 'Commodity channel index' (CCI) as my PRIMARY INDICATOR & all my scanners are a variation of this...
MULTI TIMEFRAME POSITIONAL STRATEGY using CCI...\U0001f9f5 pic.twitter.com/4O2PrBxSw9
3⃣ Only CCI based investment strategy - You can catch massive trends in stocks with good Sales/PAT growth using this
My CCI based investment strategy - How does it work? A thread.
— Trendline Investor (@dmdsplyinvestor) May 23, 2020
Objective: Identify stocks that are entering a phase of momentum on the upside and ride the stock until momentum weakens.1/n
4⃣ Tradingview code for strategy shared by @heartwon based on the long term and short term
A brilliant concept based on the long term and short term EMA by @heartwon. I'm here on twitter for such stuff that helps me build my systems. Really good one. Here is the trading view indicator that I coded. Please RT for everyone's benefit. 1/3 https://t.co/uleWiysyL1
— Trendline Investor (@dmdsplyinvestor) July 5, 2020
More from Rs
This learning thread would be on
"𝙐𝙨𝙚𝙨 𝙤𝙛 𝙍𝙚𝙡𝙖𝙩𝙞𝙫𝙚 𝙎𝙩𝙧𝙚𝙣𝙜𝙩𝙝"
Shared some strategy.
Like👍 & Retweet🔄for wider reach and for more such learning thread in the future.
1/22
Most of us would confuse it with Relative Strength Index (RSI) but Relative Strength is a different indicator.
We have already covered about "Uses of RSI" in below thread👇
https://t.co/oTOrW7joNI
One can go through this if you haven't.
2/22
#RSI is a common indicator which most of us use in the stock market.
— Yash Mehta (@YMehta_) October 22, 2021
This learning thread would be on
"\U0001d650\U0001d668\U0001d65a\U0001d668 \U0001d664\U0001d65b \U0001d64d\U0001d64e\U0001d644"
Like\U0001f44d & Retweet\U0001f504 for wider reach and for more such learning thread in the future.
Also, an investment strategy is shared using RSI in the end.
1/16
Now coming to Relative Strength (RS).
It is basically a strategy used in momentum investing which shows strength or weakness between two asset classes (two stocks, index, commodity).
One can read about this in below
As of now, I am using this indicator on .@tradingview platform.
It's free and one can add it in their Tradingview account as well, using this link👇
https://t.co/FxCjJFsNOG
There are multiple variants in this as well. Some traders use multiple time frame RS.
4/22
RS basically compares returns of one stock/index with the returns of benchmark stock/index at a particular time horizon.
Let's say, I want to analyze TCS and Benchmark Index is Nifty.
5/22
https://t.co/3q9UOn5GF7
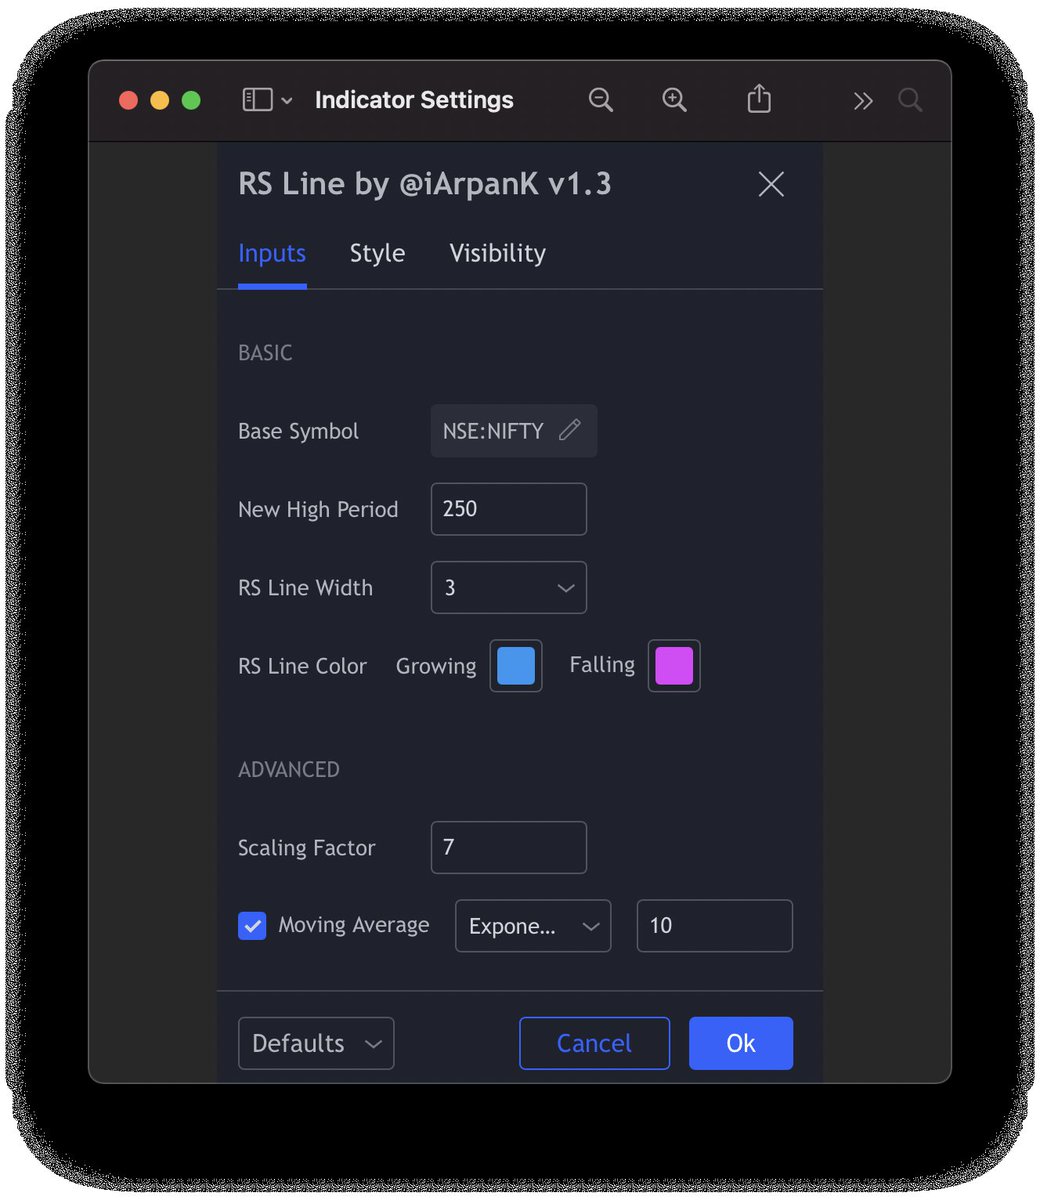
This update enables adding a Moving Average to the indicator, as requested by several users.

Indicator settings (ADVANCED section)
- Toggle moving average on/off using the checkbox
- Change indicator type (Simple/Exponential/Weighted)
- Change indicator period

Project (now open source) : https://t.co/xHpPUU4ZdN
Change indicator pane : https://t.co/u0BqraiFce
All users are requested to remove and add the indicator again to their chart, in order to utilise the new v1.3.
Thanks!