
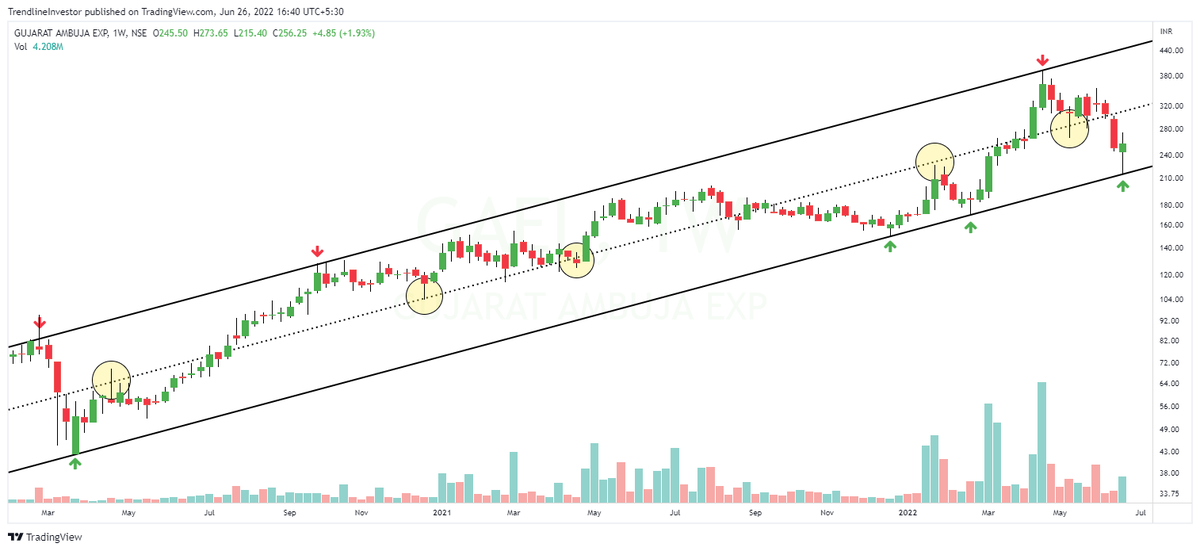
Save this chart & look at it every time you have a stock which is going down, down & down!
Just 1⃣ single rule to save your capital👇
If you are beginner, never look at a stock when CCI below -100. Look at it only above 100.
Many more stocks will soon follow a similar pattern!

More from Trendline Investor
- CCI never went into bearish territory
- Relative strength hits new highs
Expecting a strong move next week! https://t.co/rDCnSOFkxs
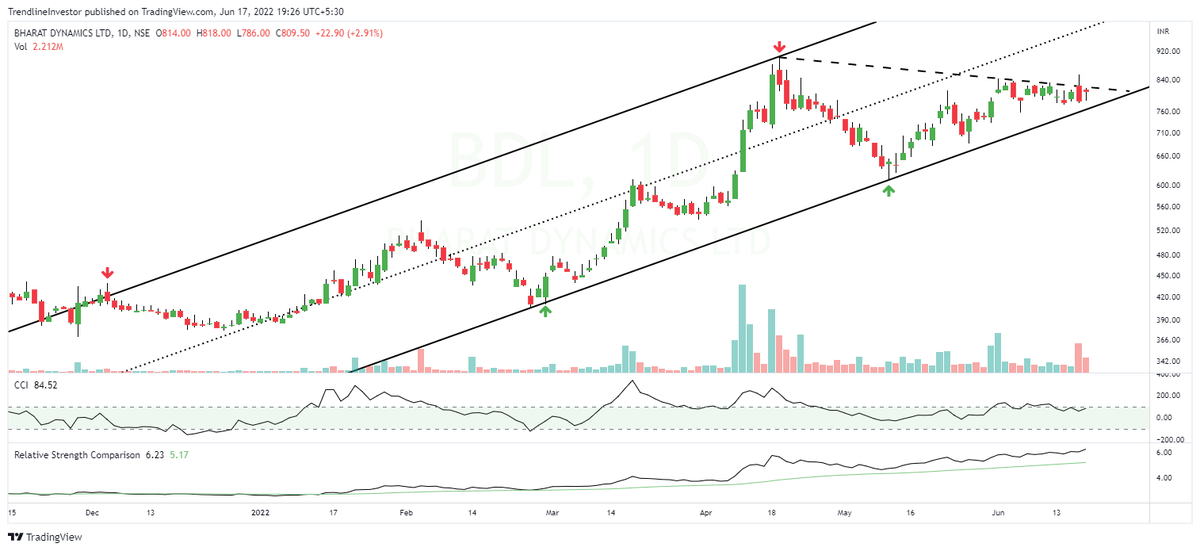
The consolidation I mentioned in #BDL is in progress and if I want to take fresh/add more to the current positions this is one way to do it - Trendline retest!
— Trendline Investor (@dmdsplyinvestor) May 4, 2022
One can also wait for a reversal confirmation before adding. https://t.co/qcUntm9NEz pic.twitter.com/5lgT8aZZpB
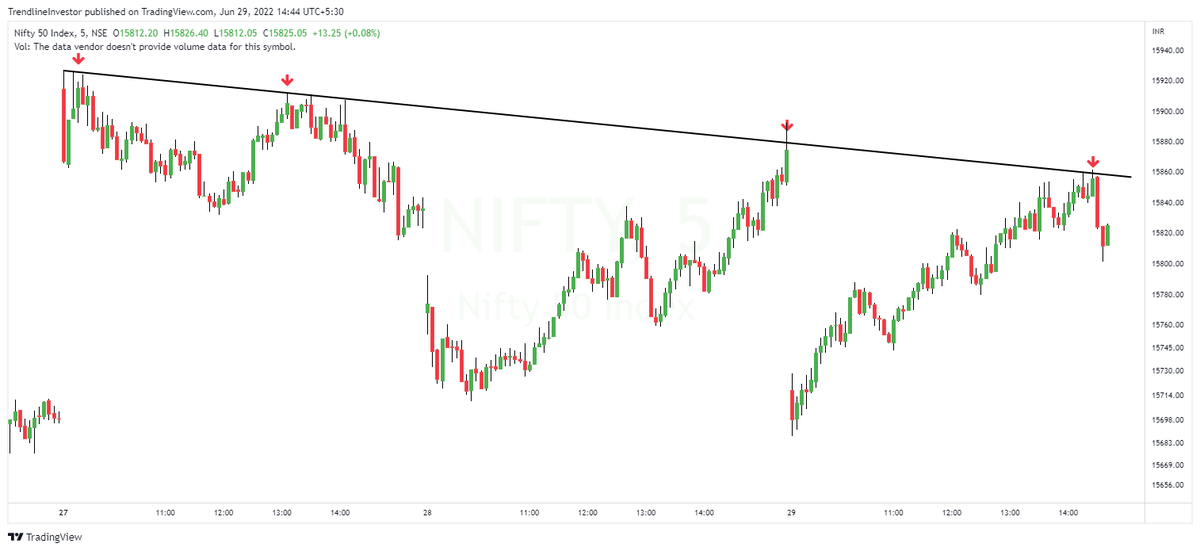
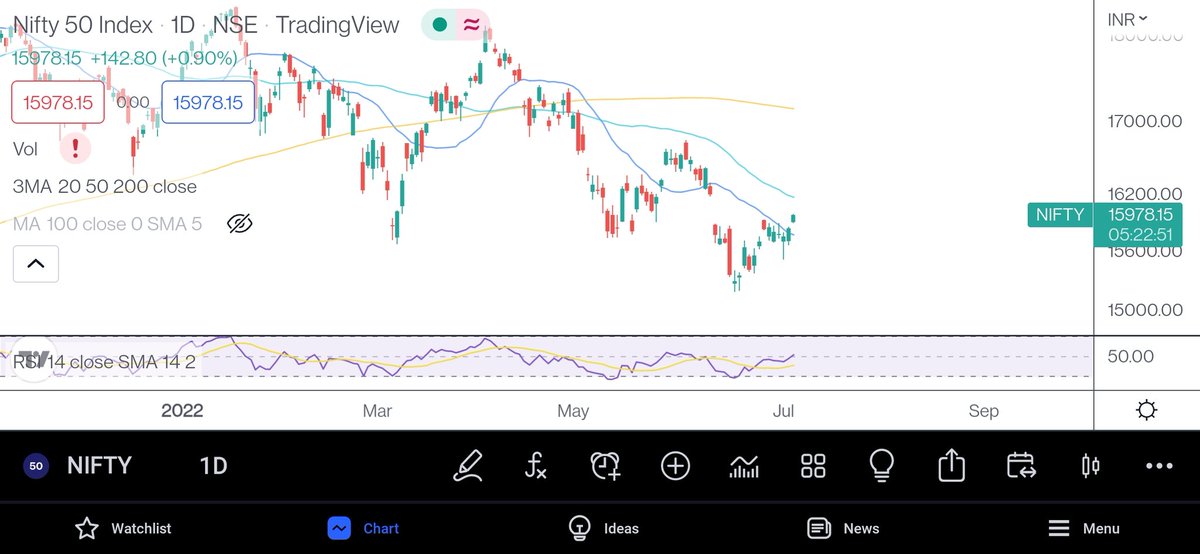
#Nifty perfect reversal after filling the gap and testing the middle of the channel.
— Trendline Investor (@dmdsplyinvestor) June 28, 2022
Waiting for Nifty to take out that major horizontal resistance and then we can see a good short term rally. https://t.co/m3hwcWno9q pic.twitter.com/WhhLPc9JaC
More from Screeners


#nifty50 https://t.co/64ZktWHQev
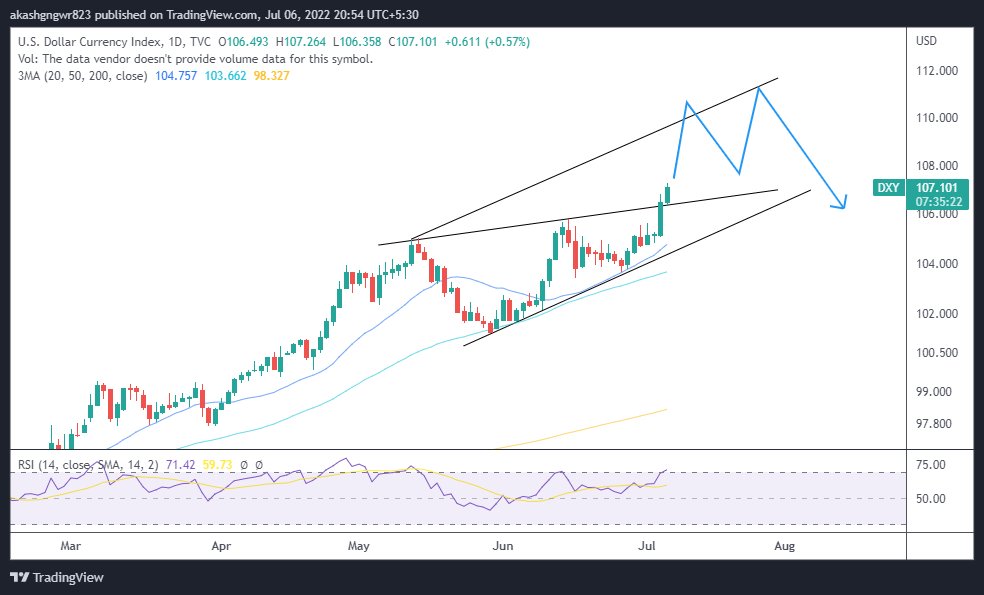
This is the maximum upside for now, post that I am looking for an 8-9% fall in index.#nifty50 pic.twitter.com/BcSOiwWuBs
— Aakash Gangwar (@akashgngwr823) June 24, 2022
You May Also Like



Here I will share what I believe are essentials for anybody who is interested in stock markets and the resources to learn them, its from my experience and by no means exhaustive..
First the very basic : The Dow theory, Everybody must have basic understanding of it and must learn to observe High Highs, Higher Lows, Lower Highs and Lowers lows on charts and their
Even those who are more inclined towards fundamental side can also benefit from Dow theory, as it can hint start & end of Bull/Bear runs thereby indication entry and exits.
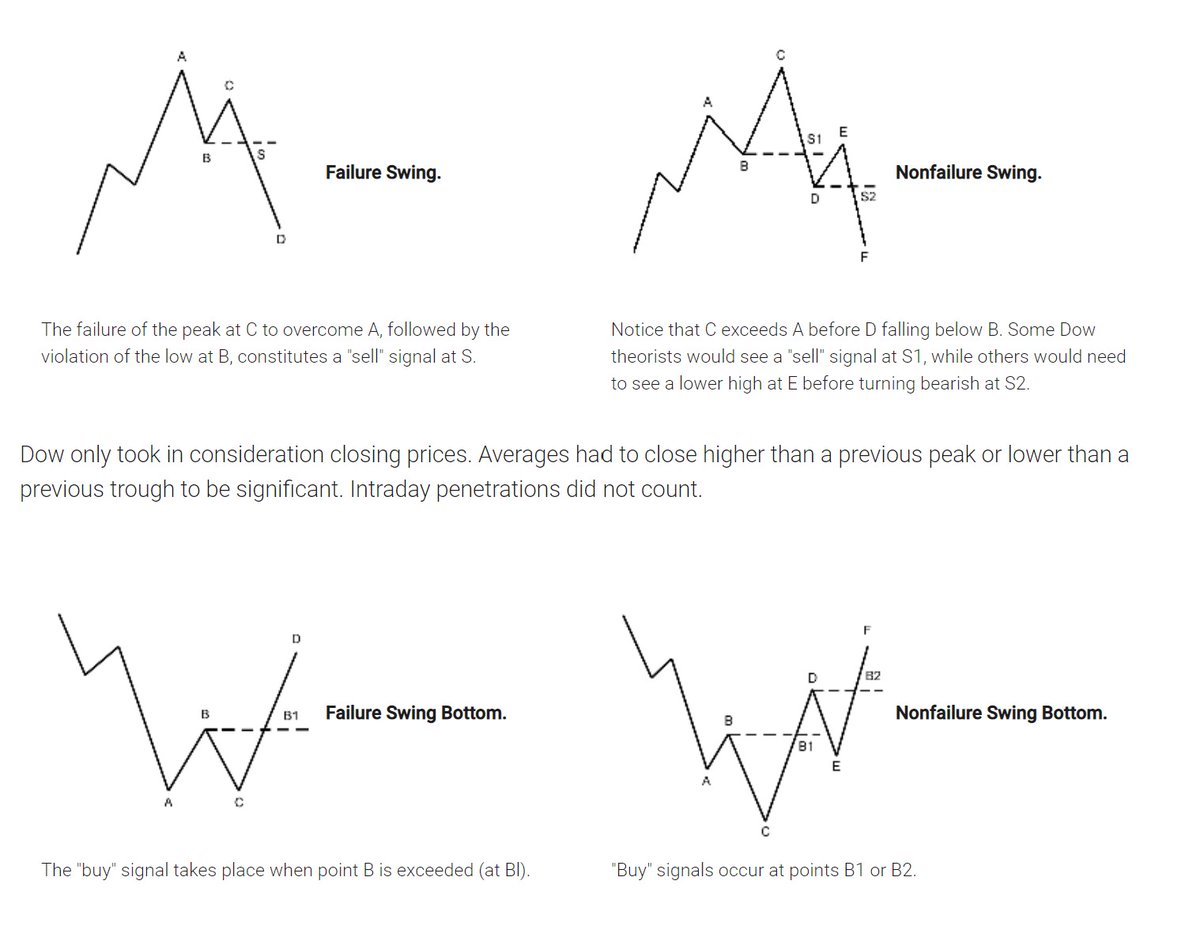
Next basic is Wyckoff's Theory. It tells how accumulation and distribution happens with regularity and how the market actually
Dow theory is old but
Old is Gold....
— Professor (@DillikiBiili) January 23, 2020
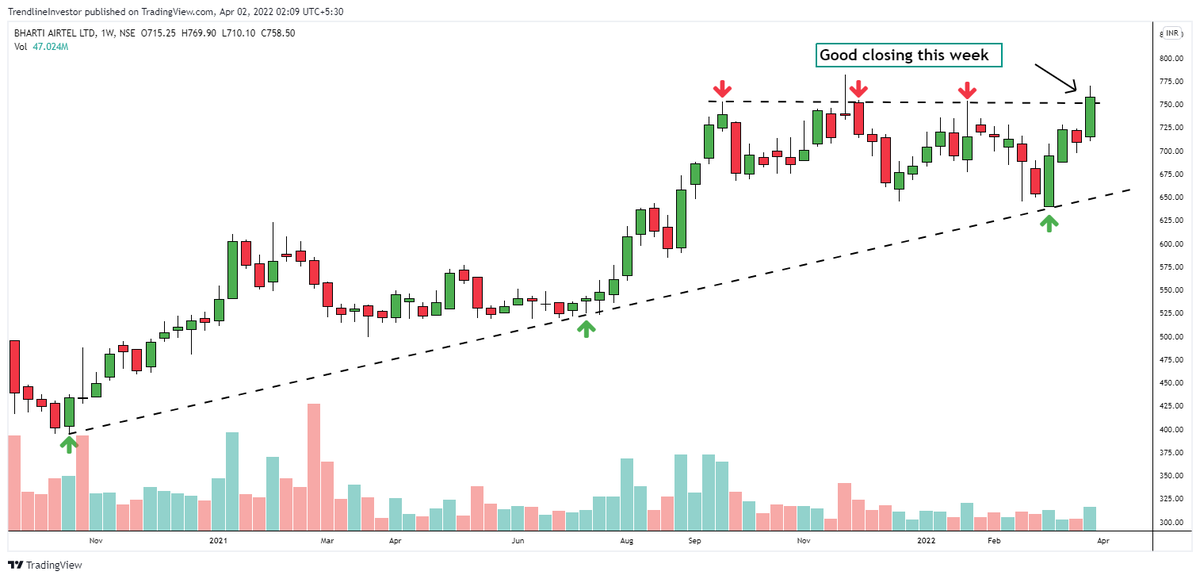
this Bharti Airtel chart is a true copy of the Wyckoff Pattern propounded in 1931....... pic.twitter.com/tQ1PNebq7d
