1. Multi-timeframe Technical Analysis
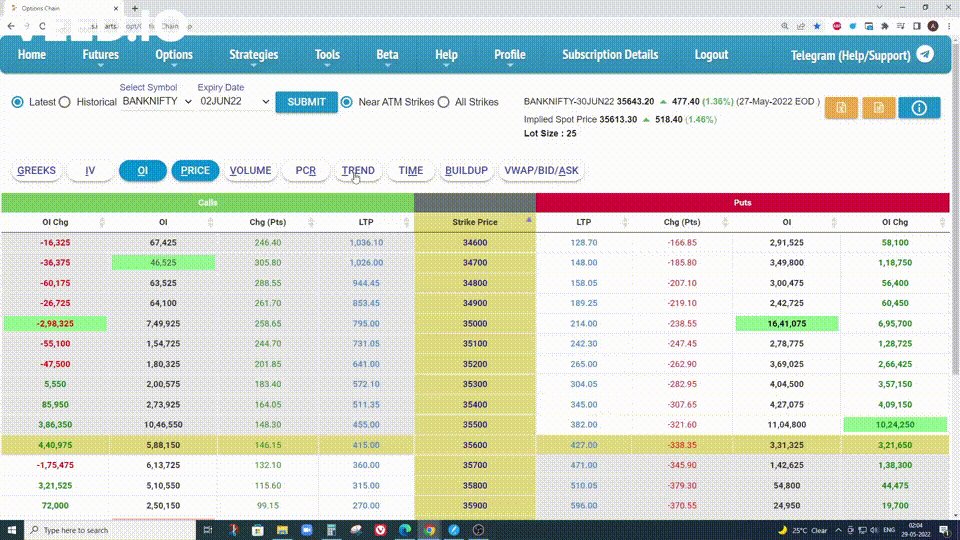
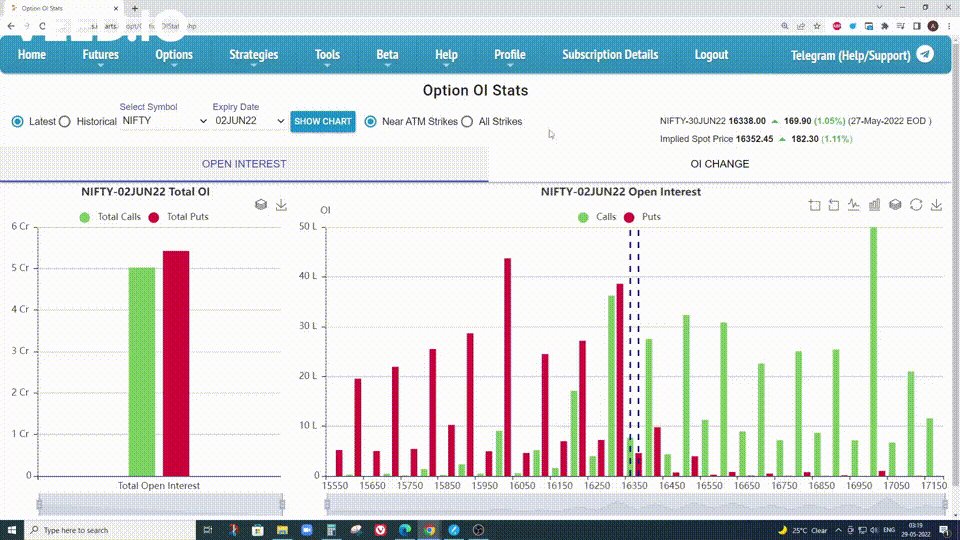
2. Option Chain Data
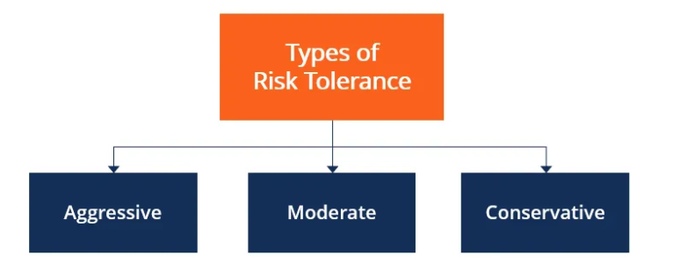
Also, 3 strategies to deploy for:
1. Aggressive Traders (3.36%)
2. Moderate Risk Traders (1.89%)
3. Low-Risk Traders (0.72%)


— Harsh (@HarshAsserts) September 11, 2020
When trading,moods will want to influence ur decisions
— Banknifty Addict (Gaurav) (@BankniftyA) December 29, 2019
How to minimize:
-Have a backtested plan/system
-Know yourself(emotion and panic levels)
So trade size is important to keep ur emotions in check
-dont focus too much on pnl
-have a back up plan ready
& last stay positive!!
Backtest the complete expiry and practice again and again till u develop conviction
— Banknifty Addict (Gaurav) (@BankniftyA) November 5, 2020
Support and resistance levels based on technical charts on various time frames.
— Banknifty Addict (Gaurav) (@BankniftyA) December 19, 2019
Breaking any of the above, leads to a direction
and then only directional play.
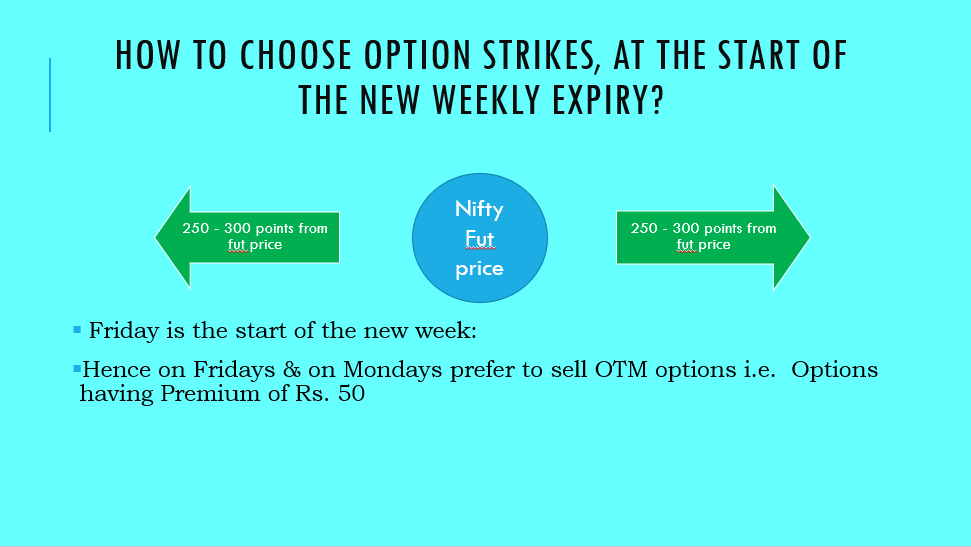
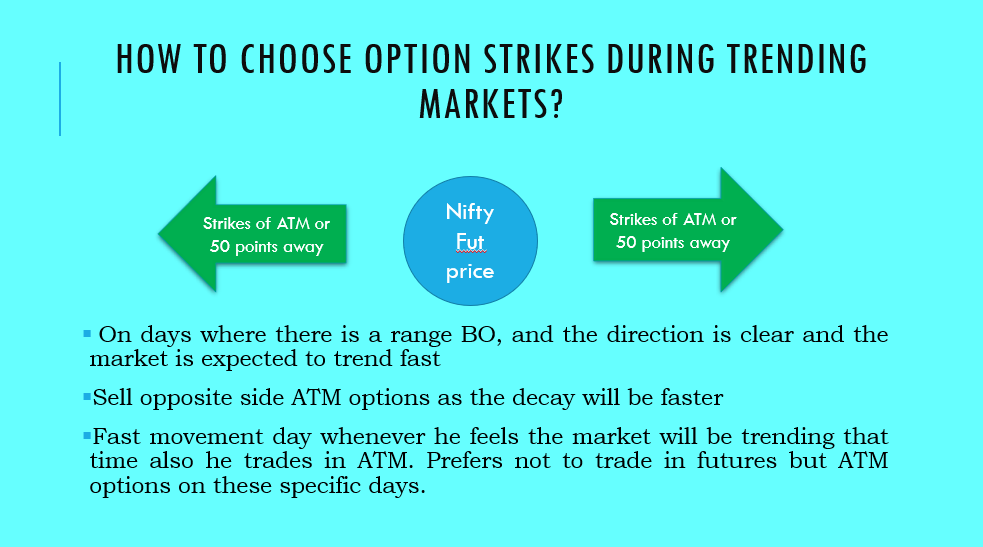
How to sell option?
— Mitesh Patel (@Mitesh_Engr) January 30, 2021
Here let me explain through simple math.
Say BN at 30000
30000 straddle trading at combine premium 800 ( based on current volatility)
Put at 400
Call at 400
You don\u2019t know direction. Sold both.
If move will not come than both will decrease gradually.
4/10
— Dr. Thomas Binder, MD (@Thomas_Binder) October 22, 2020
...indication, first of all that testing for a (single) respiratory virus is done outside of surveillance systems or need for specific therapy, but even so the lack of consideration of Ct, symptoms and clinical findings when interpreting its result. https://t.co/gHH6kwRdZG
6/10
— Dr. Thomas Binder, MD (@Thomas_Binder) October 22, 2020
The neither validated nor standardised hypersensitive RT-PCR test / Ct 35-45 for SARS-CoV-2 is abused to mislabel (also) other diseases, especially influenza, as COVID-19.https://t.co/AkFIfTCTkS
External peer review of the RTPCR test to detect SARS-CoV-2 reveals 10 major scientific flaws at the molecular and methodological level: consequences for false positive results.https://t.co/mbNY8bdw1p pic.twitter.com/OQBD4grMth
— Dr. Thomas Binder, MD (@Thomas_Binder) November 29, 2020
Thread web\u2b06\ufe0f\u2b07\ufe0f
— Dr. Thomas Binder, MD (@Thomas_Binder) December 16, 2020
The fabrication of the "asymptomatic (super) spreader" is the coronation of the total nons(ci)ense in the belief system of #CoronasWitnesses.
Asymptomatic transmission 0.7%; 95% CI 0%-4.9% - could well be 0%!https://t.co/VeZTzxXfvT
8/8
— Dr. Thomas Binder, MD (@Thomas_Binder) March 24, 2020
By the way, who the f*** created this obviously (almost) worldwide definition of #CoronaDeath?
This is not only medical malpractice, this is utterly insane!https://t.co/FFsTx4L2mw