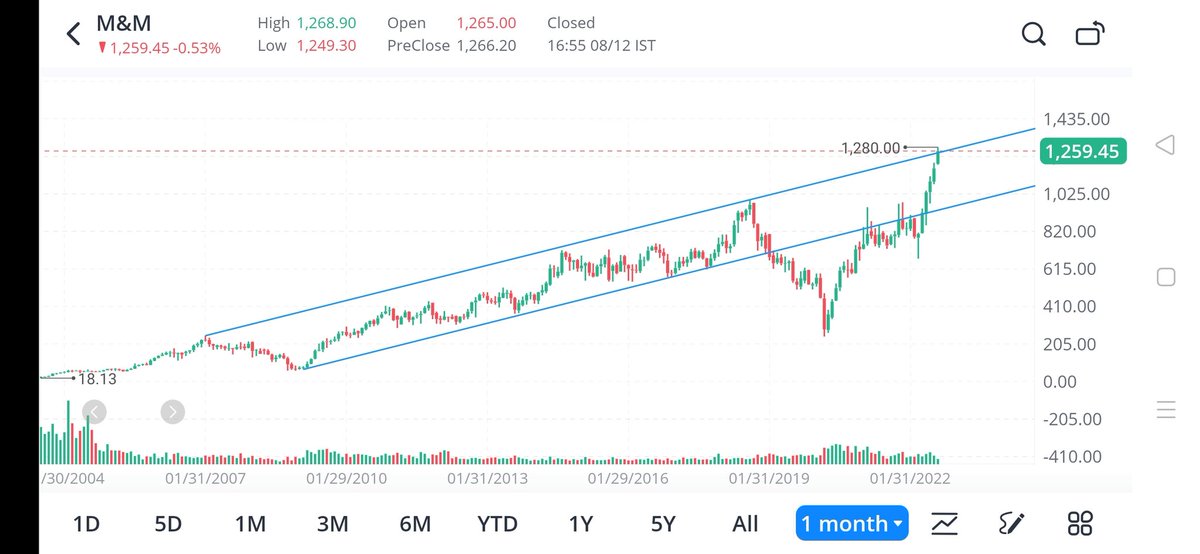
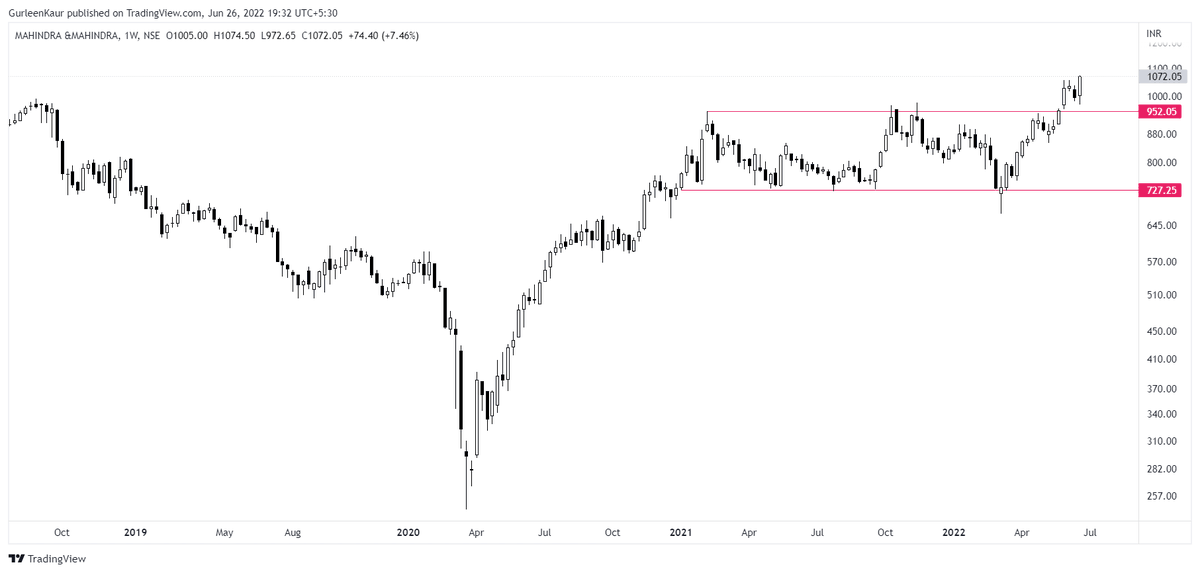
Mahindra & Mahindra - updated chart
A bullish flag pattern right after the breakout. Although the broader rectangle target of 1190 is way more than this bullish flag target https://t.co/wdAzb7SS7L
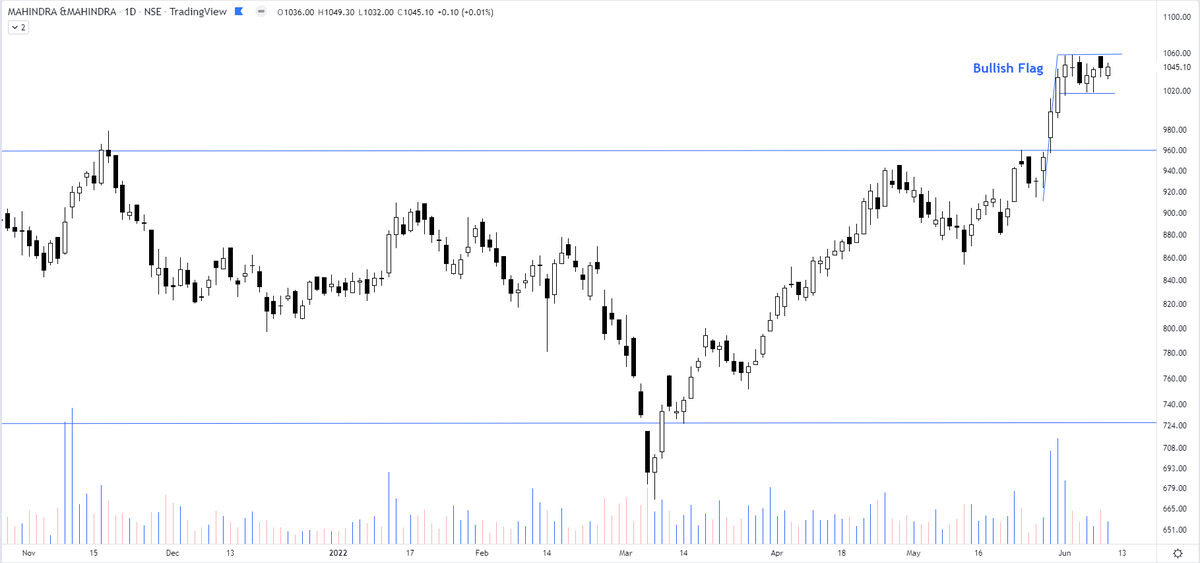
Interesting chart of Mahindra & Mahindra consolidating in a rectangle pattern & the price not falling back to the lower support. pic.twitter.com/GJ7rCfkB9f
— The_Chartist \U0001f4c8 (@charts_zone) May 26, 2022
More from The_Chartist 📈
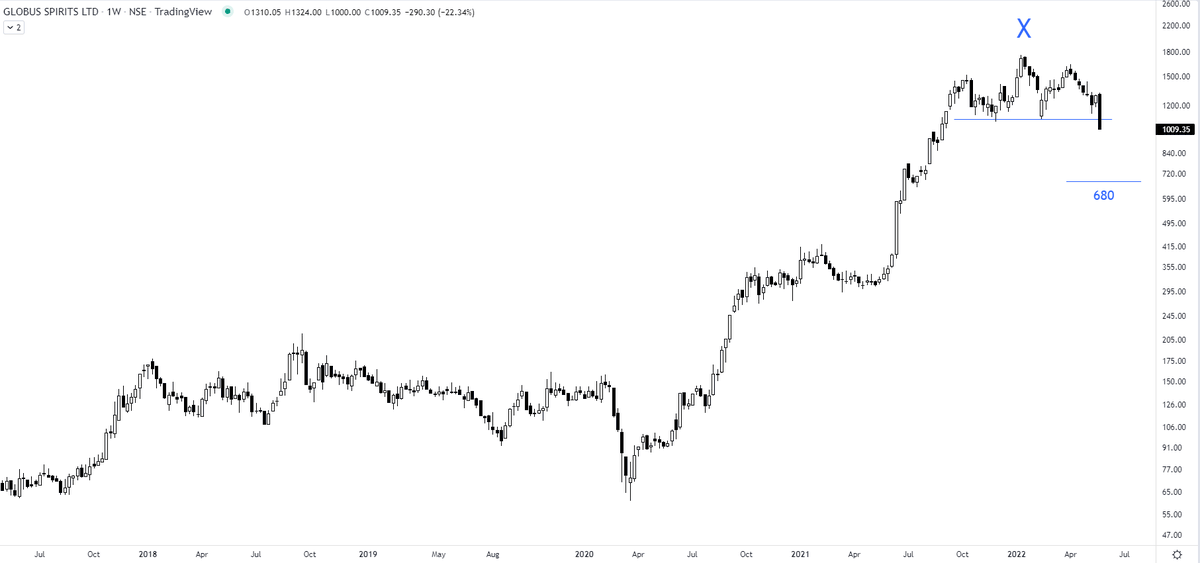
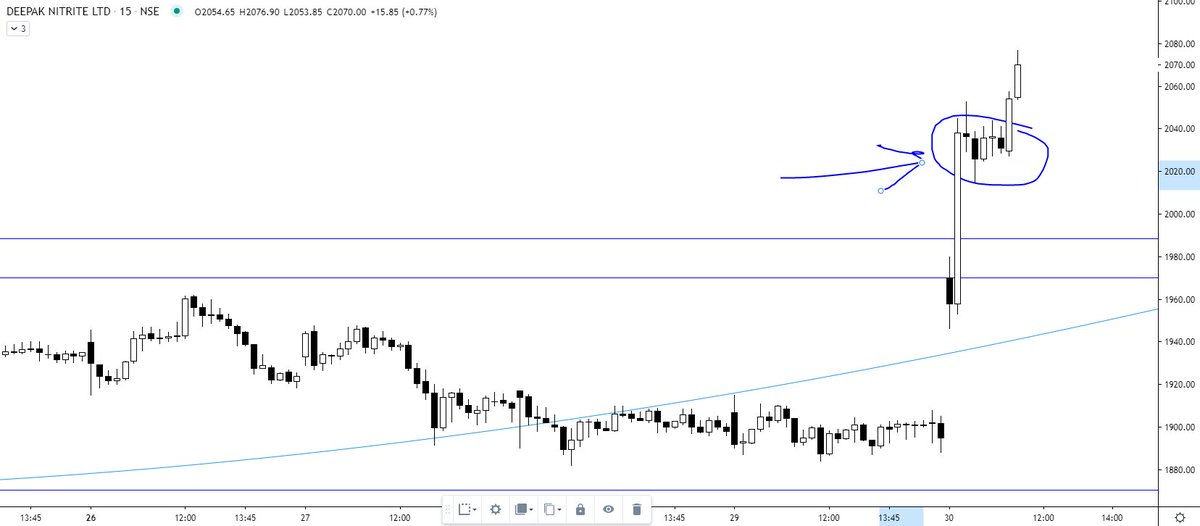
Deepak nitrite
Explained you same concept with Elxsi. The real test of a strong Breakout is that the big hand will not give you another chance to buy the share at the breakout level. They will absorb all the selling of weak hands. I mean "STRONG breakout". https://t.co/7fxFqGQl3p
Explained you same concept with Elxsi. The real test of a strong Breakout is that the big hand will not give you another chance to buy the share at the breakout level. They will absorb all the selling of weak hands. I mean "STRONG breakout". https://t.co/7fxFqGQl3p
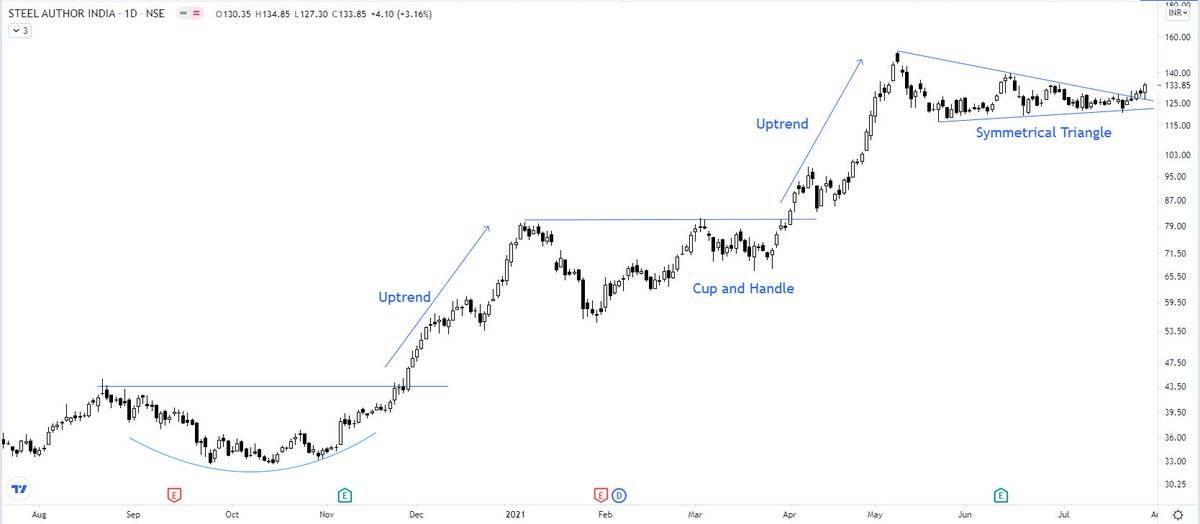
Tata Elxsi ---
— Steve Nison (@nison_steve) June 30, 2021
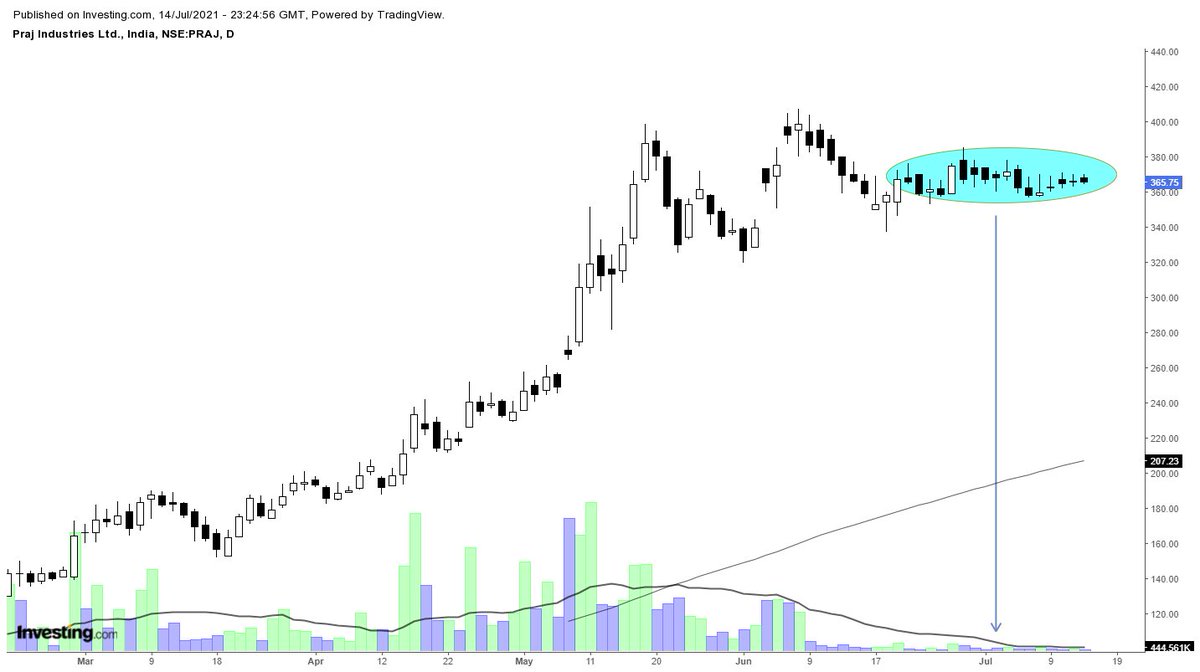
In the last 10 minutes, all the selling was absorbed despite intraday positions being squared off (if not converted). will wait for the EOD data. However, the chart structure is extremely strong. https://t.co/pci7GCDBEO pic.twitter.com/1NBD9V3mKc