
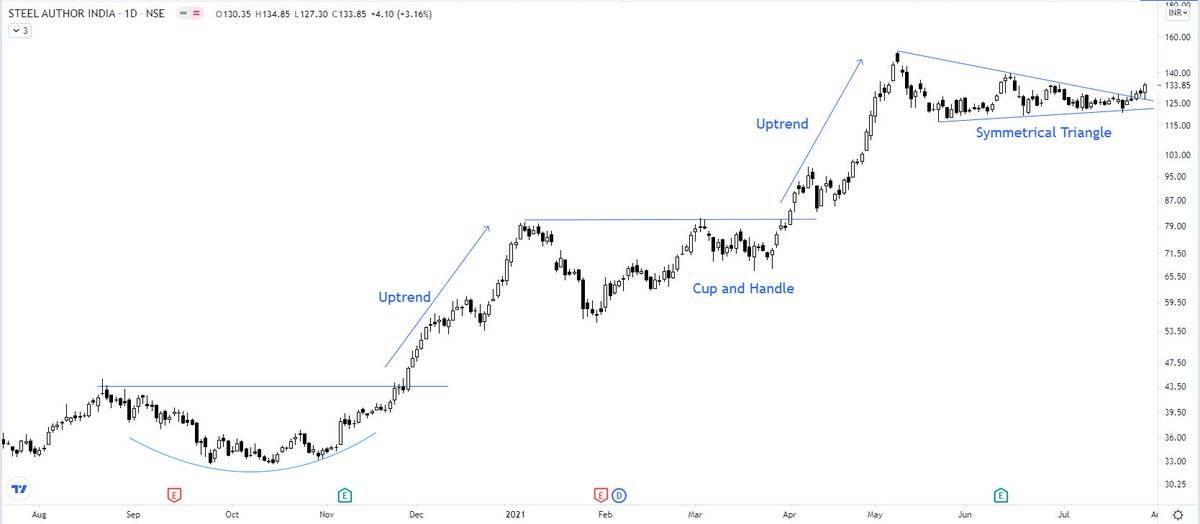
SAIL - I am not holding it as of now. Chart for learning purposes. I always have a bullish bias for a stock in a particular sector that is performing so well.
A typical example of stock taking a pause in between during its upwards journey.
More from Steve Nison
although a must-have portfolio stock. Faced resistance right at the upper channel boundary. Volumes high. Any retracement back to the lower boundary will be an opportunity to accumulate. https://t.co/5uDsUXsbPP
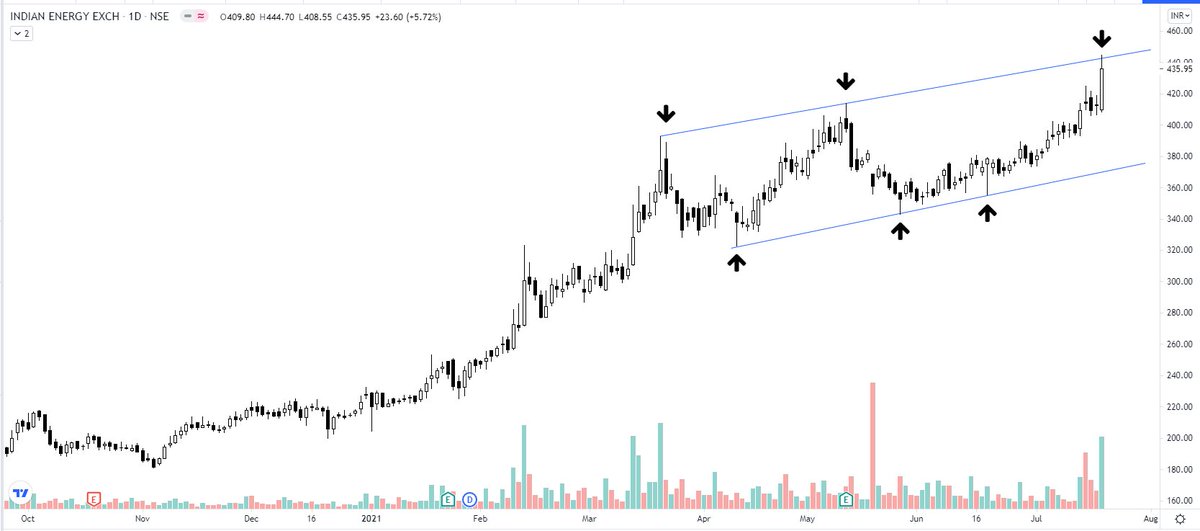
IEX - the resistance turning support. Kindly review, please. @nishkumar1977 @suru27 @rohanshah619 @indian_stockss @sanstocktrader @BissaGauravB @RajarshitaS @PAVLeader @Rishikesh_ADX @VijayThk @Investor_Mohit @TrendTrader85 pic.twitter.com/7CCzmee5If
— Steve Nison (@nison_steve) December 18, 2020


More from Sail


#Metals
#Sail Hourly Chart. We could see sellers run for cover above 126. Levels of 120 could be my stop on this one. #Metals pic.twitter.com/2CNvUZbhNY
— Dare2Dream (@Dare2Dr10109801) June 10, 2021


You May Also Like


(I am forced to do this due to continuous hounding of Sikh Extremists since yesterday)
Rani Jindan Kaur, wife of Maharaja Ranjit Singh had illegitimate relations with Lal Singh (PM of Ranjit Singh). Along with Lal Singh, she attacked Jammu, burnt - https://t.co/EfjAq59AyI

Tomorrow again same thing happens bcoz fudus like you are creating a narrative oh Khalistan. when farmers are asking MSP. (RSS ki tatti khane wale Kerni sena ke kutte).
— Ancient Economist (@_stock_tips) December 5, 2020
U kill sikhs in 1984 just politics. To BC low IQ fudu Saale entire history was politics.
Hindu villages of Jasrota, caused rebellion in Jammu, attacked Kishtwar.
Ancestors of Raja Ranjit Singh, The Sansi Tribe used to give daughters as concubines to Jahangir.

The Ludhiana Political Agency (Later NW Fronties Prov) was formed by less than 4000 British soldiers who advanced from Delhi and reached Ludhiana, receiving submissions of all sikh chiefs along the way. The submission of the troops of Raja of Lahore (Ranjit Singh) at Ambala.
Dabistan a contemporary book on Sikh History tells us that Guru Hargobind broke Naina devi Idol Same source describes Guru Hargobind serving a eunuch
YarKhan. (ref was proudly shared by a sikh on twitter)
Gobind Singh followed Bahadur Shah to Deccan to fight for him.

In Zafarnama, Guru Gobind Singh states that the reason he was in conflict with the Hill Rajas was that while they were worshiping idols, while he was an idol-breaker.
And idiot Hindus place him along Maharana, Prithviraj and Shivaji as saviours of Dharma.


One thing I've been noticing about responses to today's column is that many people still don't get how strong the forces behind regional divergence are, and how hard to reverse 1/ https://t.co/Ft2aH1NcQt
— Paul Krugman (@paulkrugman) November 20, 2018
See this thing that @lymanstoneky wrote:
And see this thing that I wrote:
And see this book that @JamesFallows wrote:
And see this other thing that I wrote: