
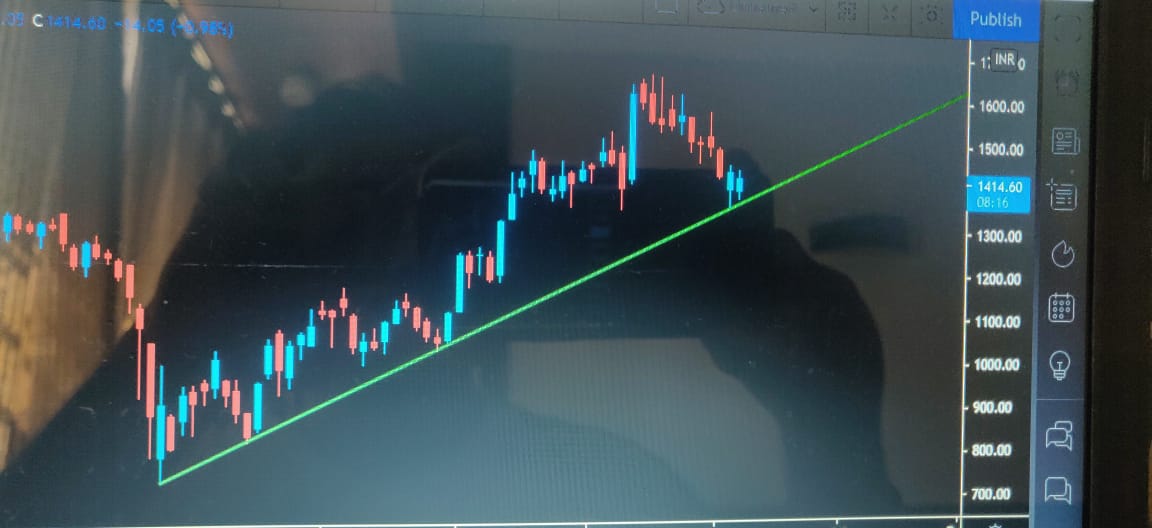
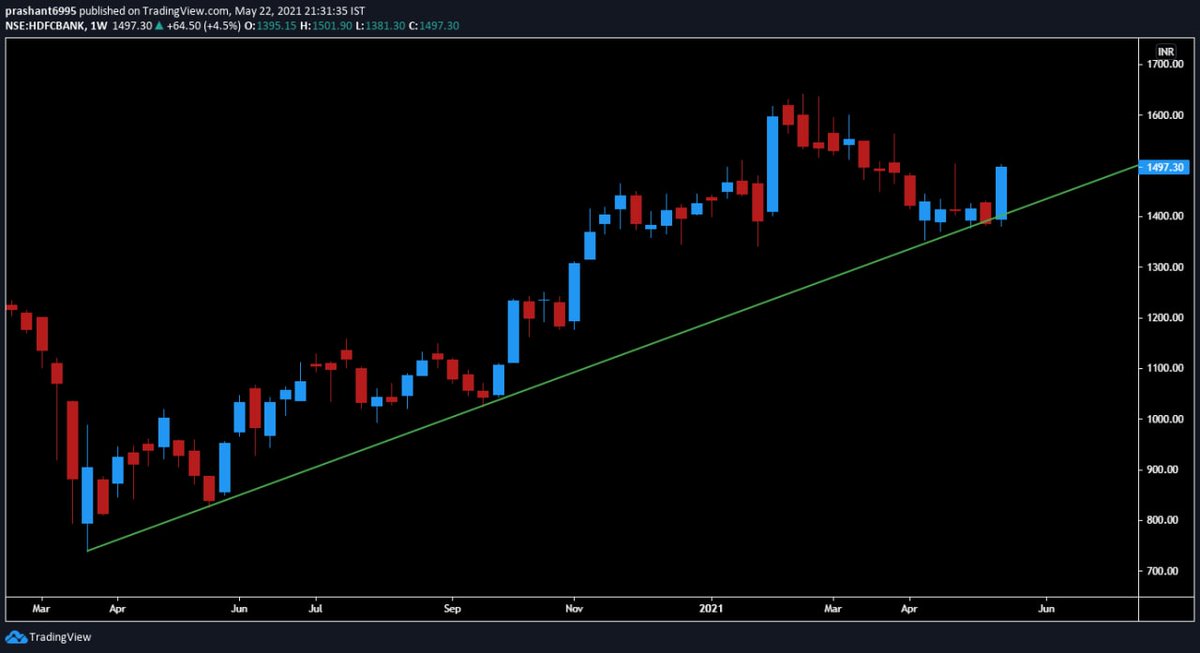
Similarly, price of a stock some years back may not be comparable with today's price in absolute terms.
A small thread on the importance of using log charts:
Similarly, price of a stock some years back may not be comparable with today's price in absolute terms.
For a 100% jump in 2002, stock would have to reach 20 (which is just Rs 10 in absolute terms)
While today, Rs 10 in absolute terms is a meagre 2-3% move
More from Prashant Bhansali


#RIL tgts are 2180 and 1820 positional over next few months if the high made at 2856 doesn't cross.
Not looking good.
Not looking good.
#RELIANCE update
— Prashant Bhansali (@prashant280294) April 28, 2022
Was expecting 5th wave rally towards 2800-3000 as mentioned in previous post
Move played out, but now not worth chasing anymore
Not saying the move is over, it can still go up bit more, but riskreward not good for positional longs now on, I would stay away. https://t.co/eoLshLoLBD pic.twitter.com/G0qZAEBRIX
You May Also Like


MASTER THREAD on Short Strangles.
Curated the best tweets from the best traders who are exceptional at managing strangles.
• Positional Strangles
• Intraday Strangles
• Position Sizing
• How to do Adjustments
• Plenty of Examples
• When to avoid
• Exit Criteria
How to sell Strangles in weekly expiry as explained by boss himself. @Mitesh_Engr
• When to sell
• How to do Adjustments
• Exit
Beautiful explanation on positional option selling by @Mitesh_Engr
Sir on how to sell low premium strangles yourself without paying anyone. This is a free mini course in
1st Live example of managing a strangle by Mitesh Sir. @Mitesh_Engr
• Sold Strangles 20% cap used
• Added 20% cap more when in profit
• Booked profitable leg and rolled up
• Kept rolling up profitable leg
• Booked loss in calls
• Sold only
2nd example by @Mitesh_Engr Sir on converting a directional trade into strangles. Option Sellers can use this for consistent profit.
• Identified a reversal and sold puts
• Puts decayed a lot
• When achieved 2% profit through puts then sold
Curated the best tweets from the best traders who are exceptional at managing strangles.
• Positional Strangles
• Intraday Strangles
• Position Sizing
• How to do Adjustments
• Plenty of Examples
• When to avoid
• Exit Criteria
How to sell Strangles in weekly expiry as explained by boss himself. @Mitesh_Engr
• When to sell
• How to do Adjustments
• Exit
1. Let's start option selling learning.
— Mitesh Patel (@Mitesh_Engr) February 10, 2019
Strangle selling. ( I am doing mostly in weekly Bank Nifty)
When to sell? When VIX is below 15
Assume spot is at 27500
Sell 27100 PE & 27900 CE
say premium for both 50-50
If bank nifty will move in narrow range u will get profit from both.
Beautiful explanation on positional option selling by @Mitesh_Engr
Sir on how to sell low premium strangles yourself without paying anyone. This is a free mini course in
Few are selling 20-25 Rs positional option selling course.
— Mitesh Patel (@Mitesh_Engr) November 3, 2019
Nothing big deal in that.
For selling weekly option just identify last week low and high.
Now from that low and high keep 1-1.5% distance from strike.
And sell option on both side.
1/n
1st Live example of managing a strangle by Mitesh Sir. @Mitesh_Engr
• Sold Strangles 20% cap used
• Added 20% cap more when in profit
• Booked profitable leg and rolled up
• Kept rolling up profitable leg
• Booked loss in calls
• Sold only
Sold 29200 put and 30500 call
— Mitesh Patel (@Mitesh_Engr) April 12, 2019
Used 20% capital@44 each
2nd example by @Mitesh_Engr Sir on converting a directional trade into strangles. Option Sellers can use this for consistent profit.
• Identified a reversal and sold puts
• Puts decayed a lot
• When achieved 2% profit through puts then sold
Already giving more than 2% return in a week. Now I will prefer to sell 32500 call at 74 to make it strangle in equal ratio.
— Mitesh Patel (@Mitesh_Engr) February 7, 2020
To all. This is free learning for you. How to play option to make consistent return.
Stay tuned and learn it here free of cost. https://t.co/7J7LC86oW0


