1 new chart everyday, it could be from any space ~ equities / commodities / crypto / forex / bonds , etc
Will try to do it daily 🙏💪
Here's the first one 👇
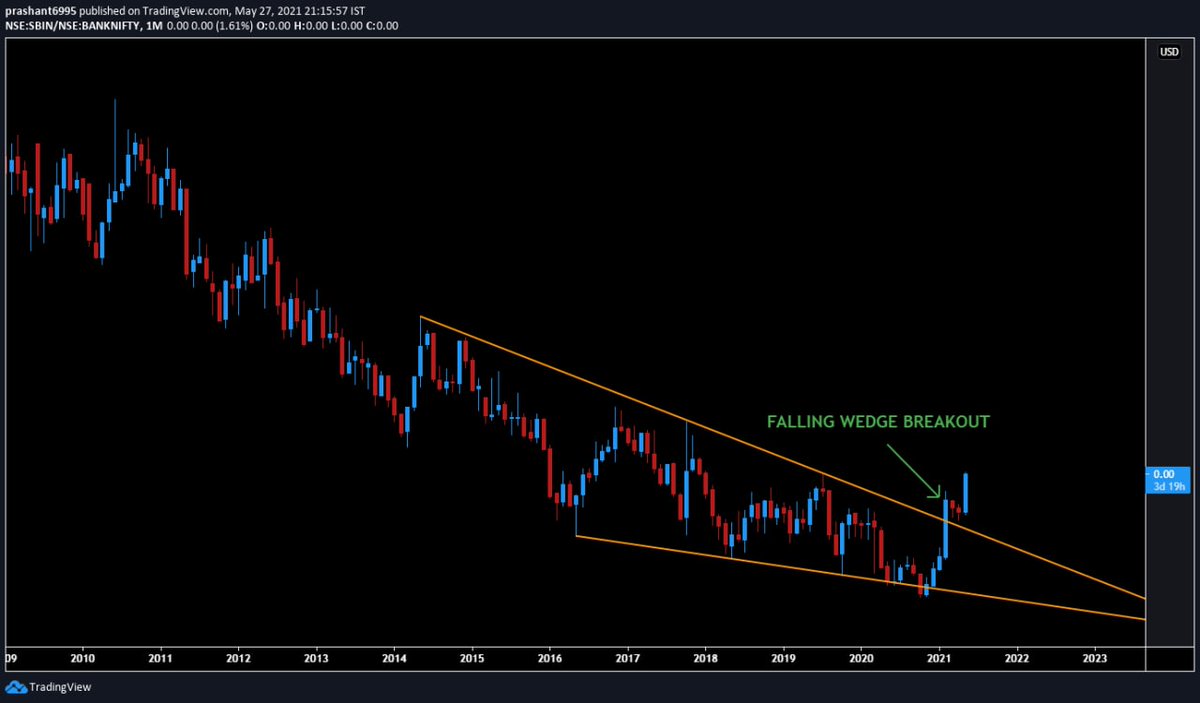
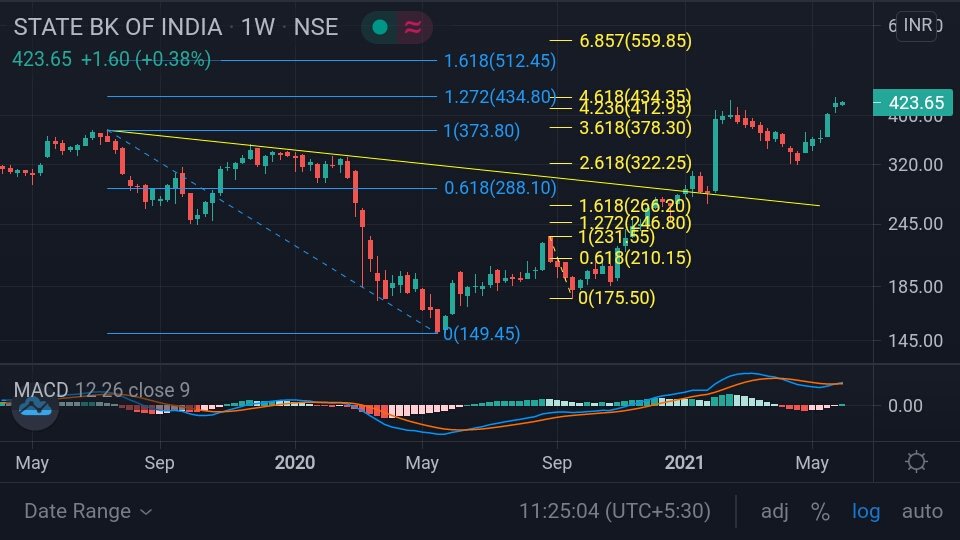
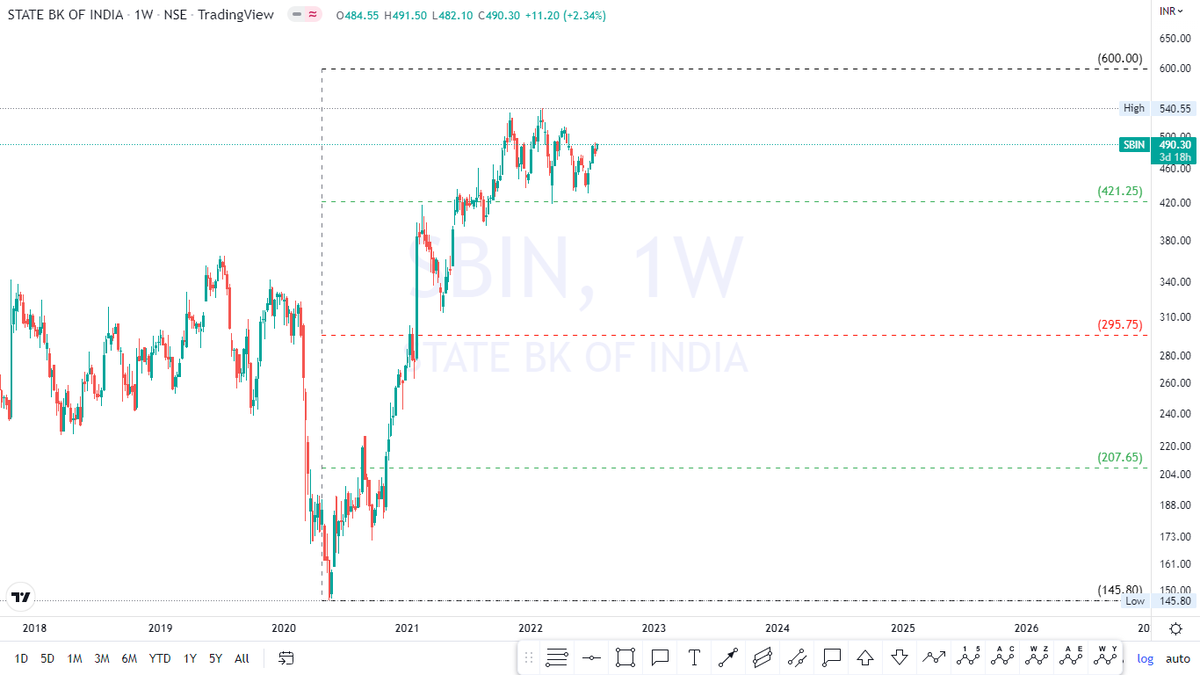
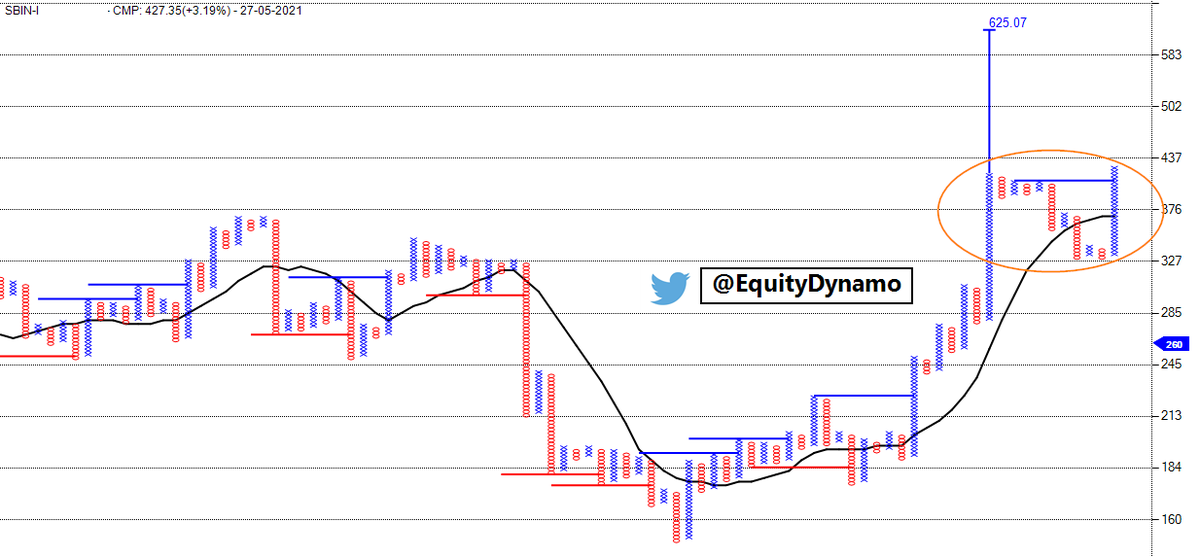
SBI vs BankNifty
Ratio chart has given monthly breakout implying SBI could outperform BN in coming months.
#PB365
More from Prashant Bhansali
Many have asked how to plot ratio charts on trading view, here is an example , suppose you want to see Maruti/Nifty auto:
1. Type the code of these two scripts exactly as shown in TV without any space and use NSE before it
NSE:MARUTI/NSE:CNXAUTO
2. Press enter
@Digital_Baba
1. Type the code of these two scripts exactly as shown in TV without any space and use NSE before it
NSE:MARUTI/NSE:CNXAUTO
2. Press enter
(10) Ratio chart (daily) of Auto Index/Nifty
— Prashant Bhansali (@prashant280294) June 5, 2021
Taking multiple support at crucial level
Autos could start outperformance over nifty as long the support holds , and more fiercely once resistance breached #PB365 pic.twitter.com/ZRSmtGH1ic
@Digital_Baba
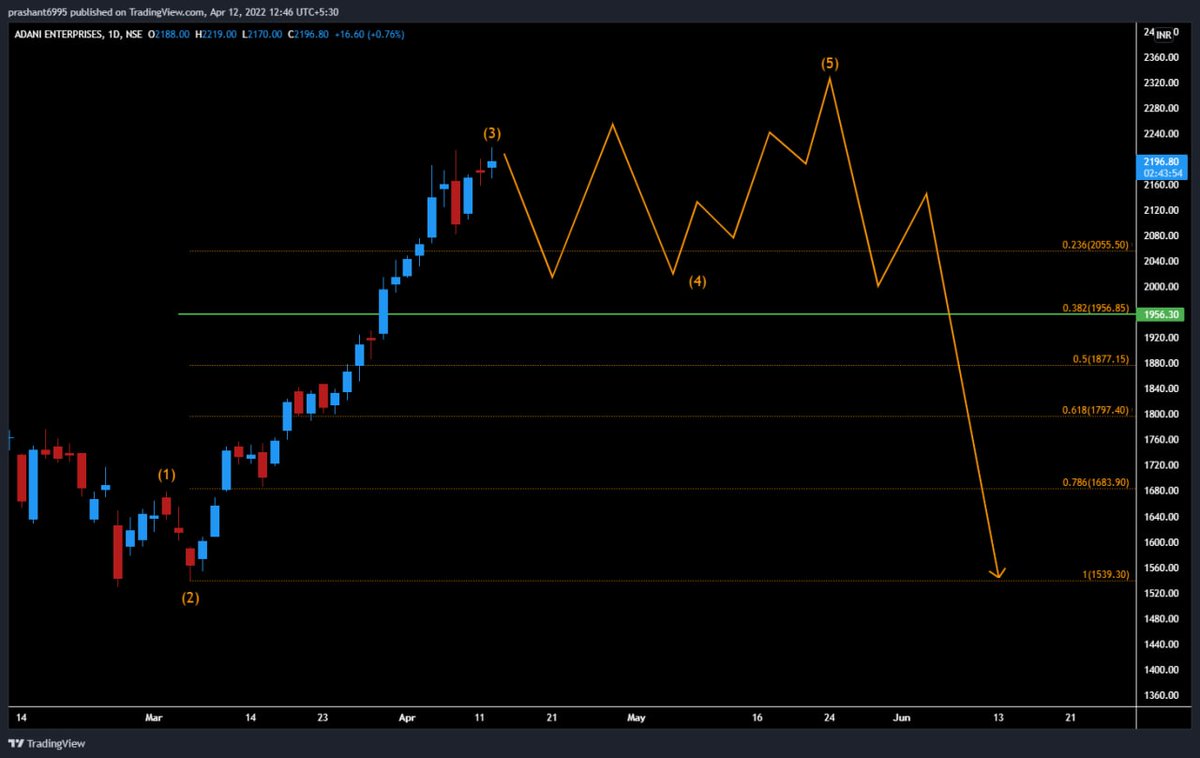

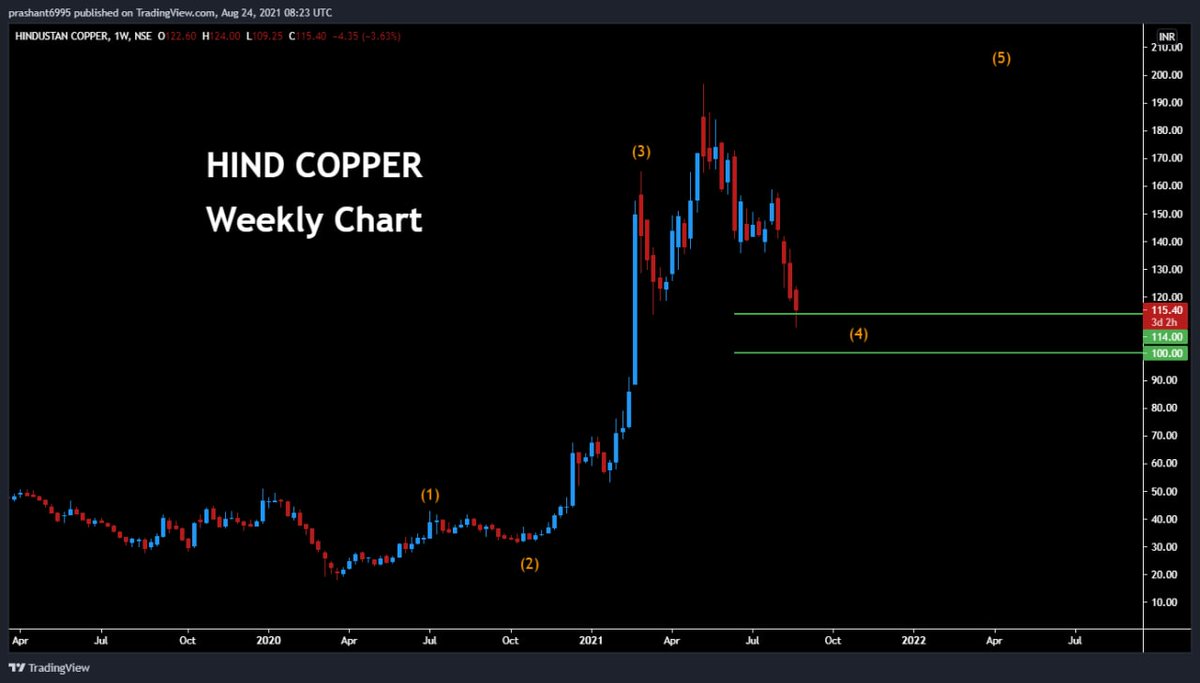
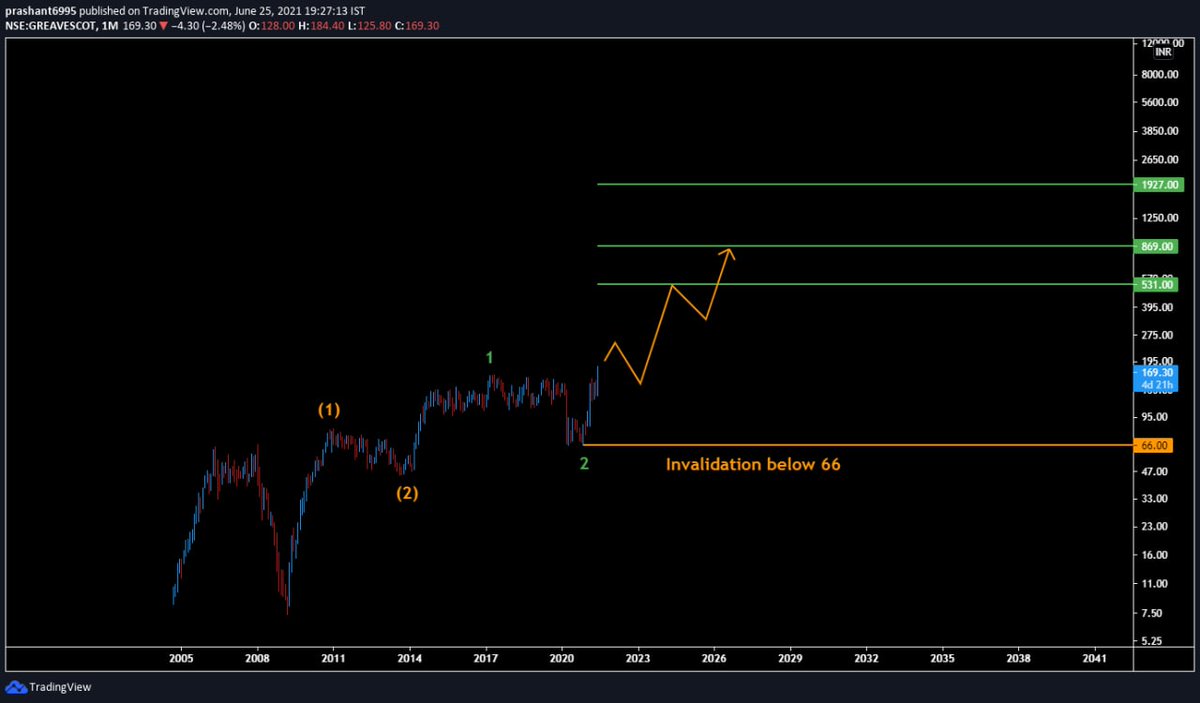
#GreavesCotton
#EW
Here's my view based on EW purely for long term
We could witness a big big 3rd wave in coming months
#investmentidea https://t.co/5laFyd8A7X
#EW
Here's my view based on EW purely for long term
We could witness a big big 3rd wave in coming months
#investmentidea https://t.co/5laFyd8A7X
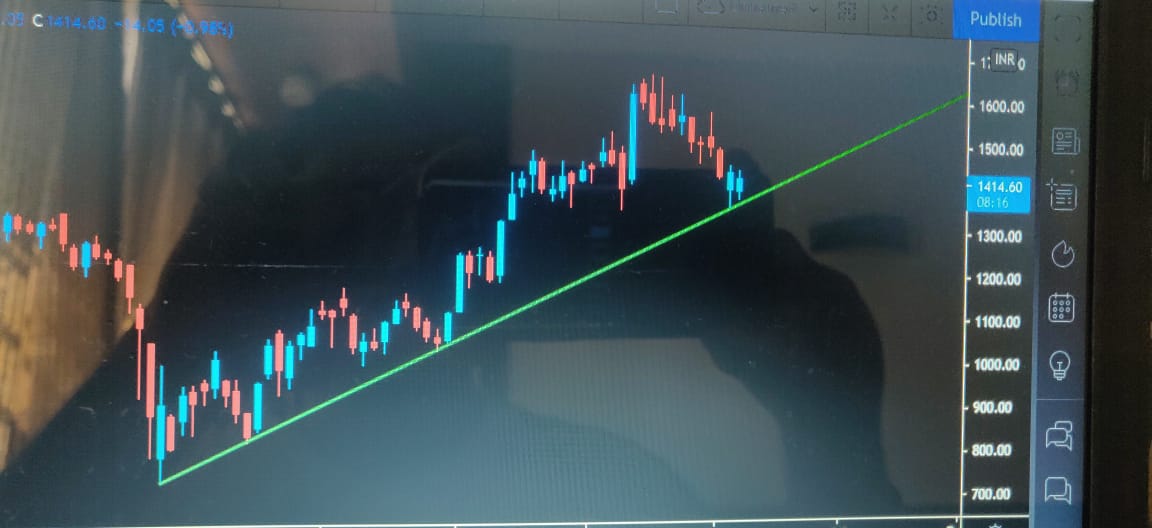
(30) #GreavesCotton monthly chart
— Prashant Bhansali (@prashant280294) June 25, 2021
Big monthly breakout underway
Is it time to move to next orbit higher ? Looks like! #PB365 pic.twitter.com/CB0OtIow7G
More from Sbin


You May Also Like


BREAKING: @CommonsCMS @DamianCollins just released previously sealed #Six4Three @Facebook documents:
Some random interesting tidbits:
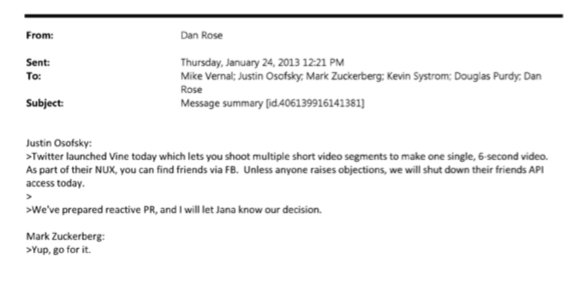
1) Zuck approves shutting down platform API access for Twitter's when Vine is released #competition
2) Facebook engineered ways to access user's call history w/o alerting users:
Team considered access to call history considered 'high PR risk' but 'growth team will charge ahead'. @Facebook created upgrade path to access data w/o subjecting users to Android permissions dialogue.
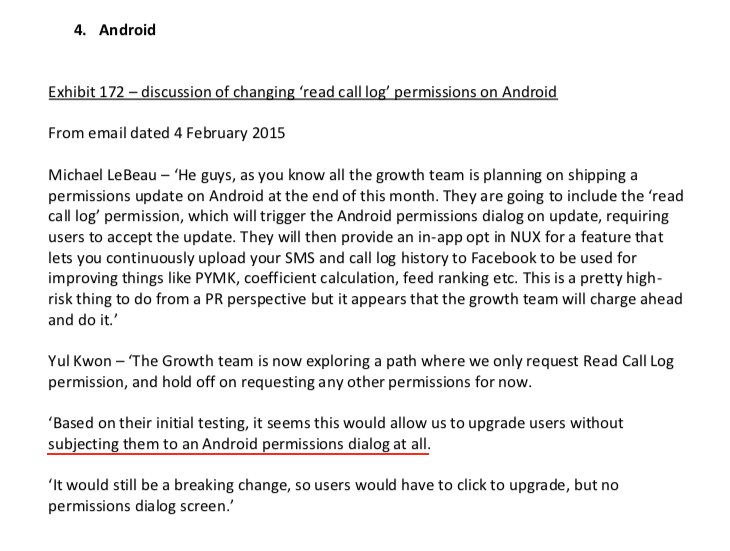
3) The above also confirms @kashhill and other's suspicion that call history was used to improve PYMK (People You May Know) suggestions and newsfeed rankings.
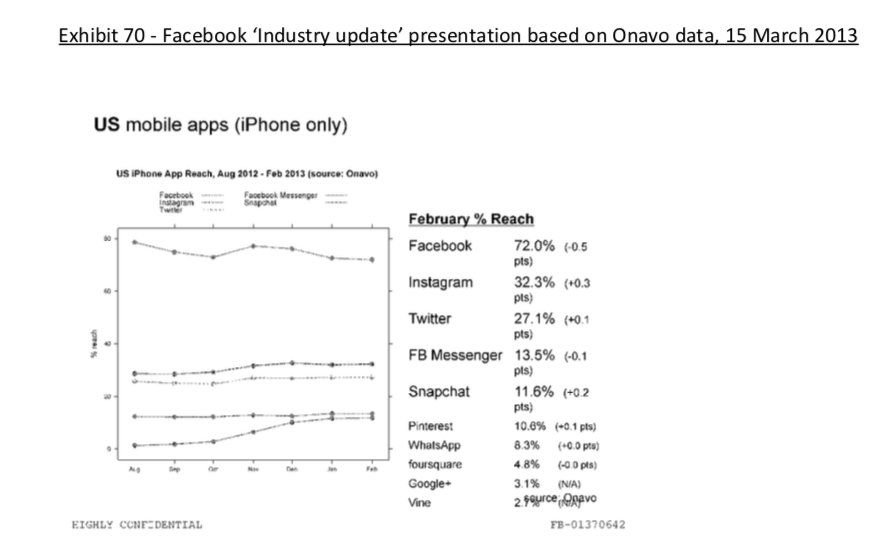
4) Docs also shed more light into @dseetharaman's story on @Facebook monitoring users' @Onavo VPN activity to determine what competitors to mimic or acquire in 2013.
https://t.co/PwiRIL3v9x
Some random interesting tidbits:
1) Zuck approves shutting down platform API access for Twitter's when Vine is released #competition
2) Facebook engineered ways to access user's call history w/o alerting users:
Team considered access to call history considered 'high PR risk' but 'growth team will charge ahead'. @Facebook created upgrade path to access data w/o subjecting users to Android permissions dialogue.
3) The above also confirms @kashhill and other's suspicion that call history was used to improve PYMK (People You May Know) suggestions and newsfeed rankings.
4) Docs also shed more light into @dseetharaman's story on @Facebook monitoring users' @Onavo VPN activity to determine what competitors to mimic or acquire in 2013.
https://t.co/PwiRIL3v9x