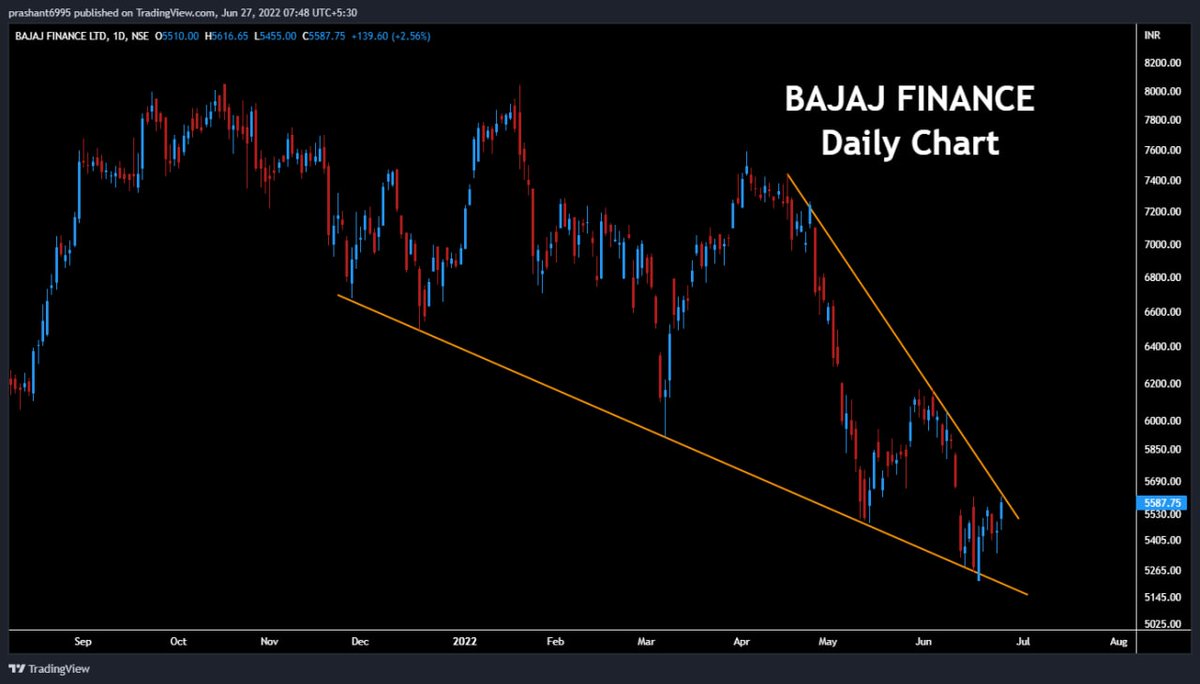
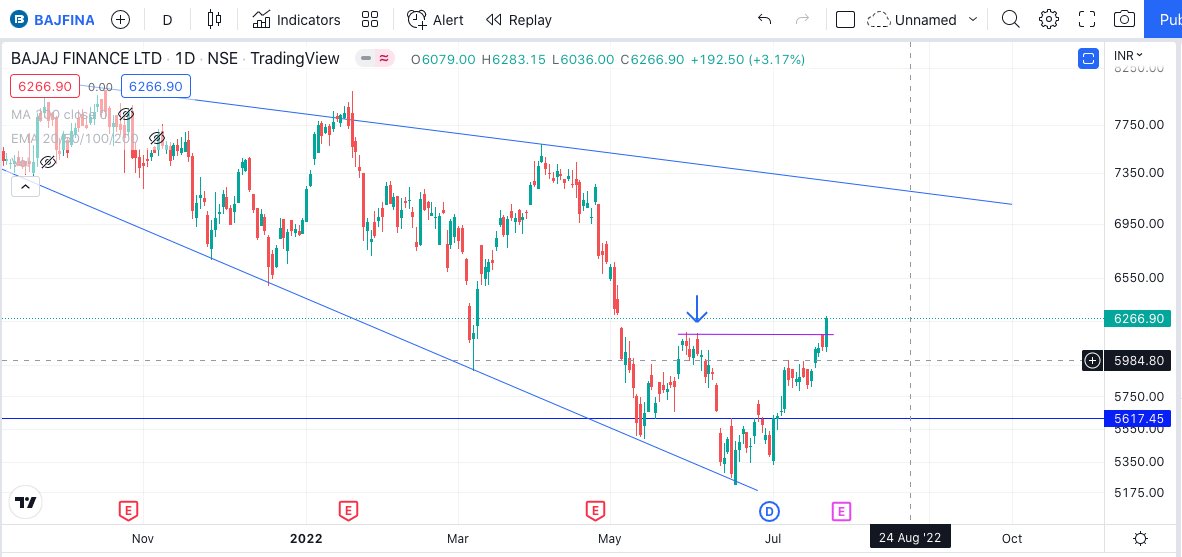
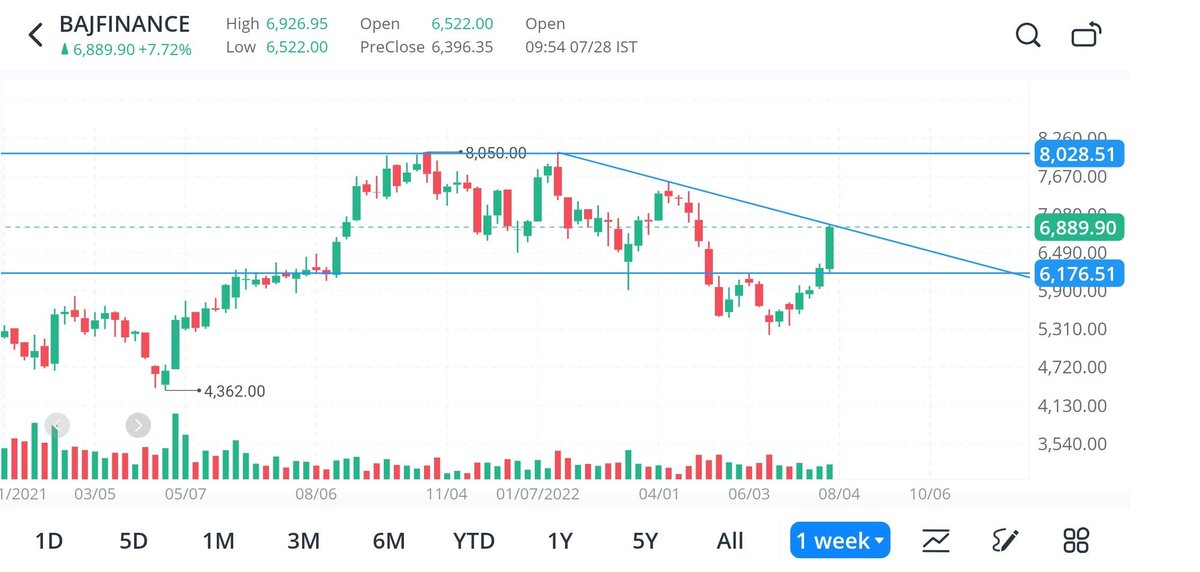
#BajajFinance
Falling wedge No.3 😉 (last week posted #CanBank #Larsen)
More from Prashant Bhansali
#GreavesCotton
#EW
Here's my view based on EW purely for long term
We could witness a big big 3rd wave in coming months
#investmentidea https://t.co/5laFyd8A7X
#EW
Here's my view based on EW purely for long term
We could witness a big big 3rd wave in coming months
#investmentidea https://t.co/5laFyd8A7X
(30) #GreavesCotton monthly chart
— Prashant Bhansali (@prashant280294) June 25, 2021
Big monthly breakout underway
Is it time to move to next orbit higher ? Looks like! #PB365 pic.twitter.com/CB0OtIow7G
More from Bajajfinancelongterm
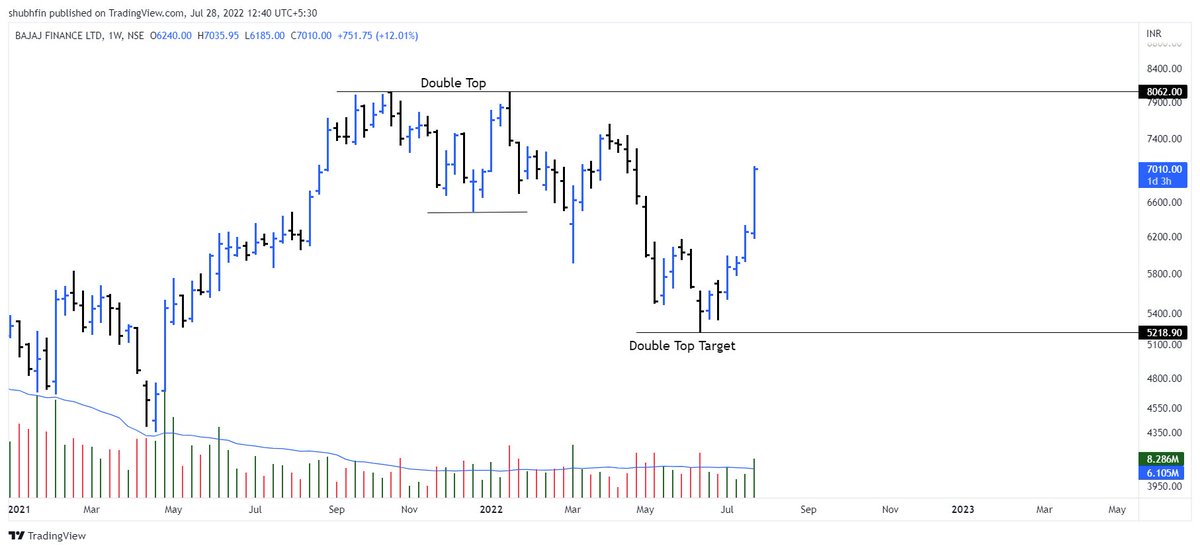
Invalidation level can be brought up to 4900 also.. #BajajFinance
Was looking at #BajajFinance chart once again. I am not able to complete 5 waves yet...hmmm...\U0001f928
— Harsh / \ud5c8\uc26c (@_Harsh_Mehta_) June 17, 2022
As posted earlier, the drop is still 4th (invalidation below 4500).
And target still remains open for 10K+ https://t.co/DozJzNhuuI pic.twitter.com/jPRaEQoPH3
You May Also Like
1/OK, data mystery time.
This New York Times feature shows China with a Gini Index of less than 30, which would make it more equal than Canada, France, or the Netherlands. https://t.co/g3Sv6DZTDE
That's weird. Income inequality in China is legendary.
Let's check this number.
2/The New York Times cites the World Bank's recent report, "Fair Progress? Economic Mobility across Generations Around the World".
The report is available here:
3/The World Bank report has a graph in which it appears to show the same value for China's Gini - under 0.3.
The graph cites the World Development Indicators as its source for the income inequality data.
4/The World Development Indicators are available at the World Bank's website.
Here's the Gini index: https://t.co/MvylQzpX6A
It looks as if the latest estimate for China's Gini is 42.2.
That estimate is from 2012.
5/A Gini of 42.2 would put China in the same neighborhood as the U.S., whose Gini was estimated at 41 in 2013.
I can't find the <30 number anywhere. The only other estimate in the tables for China is from 2008, when it was estimated at 42.8.