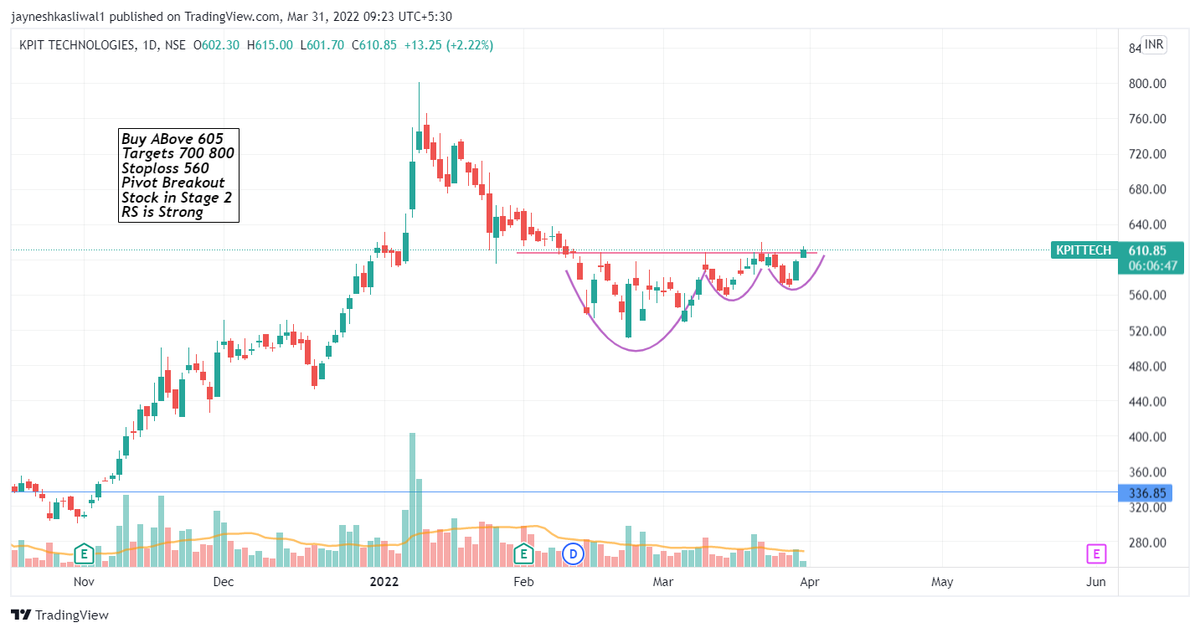
$KPITTECH.NSE
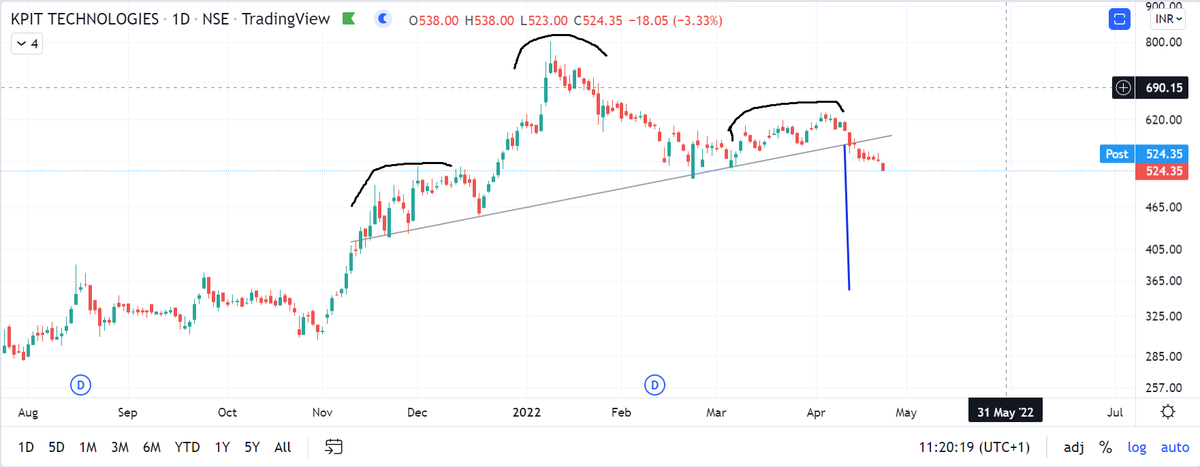
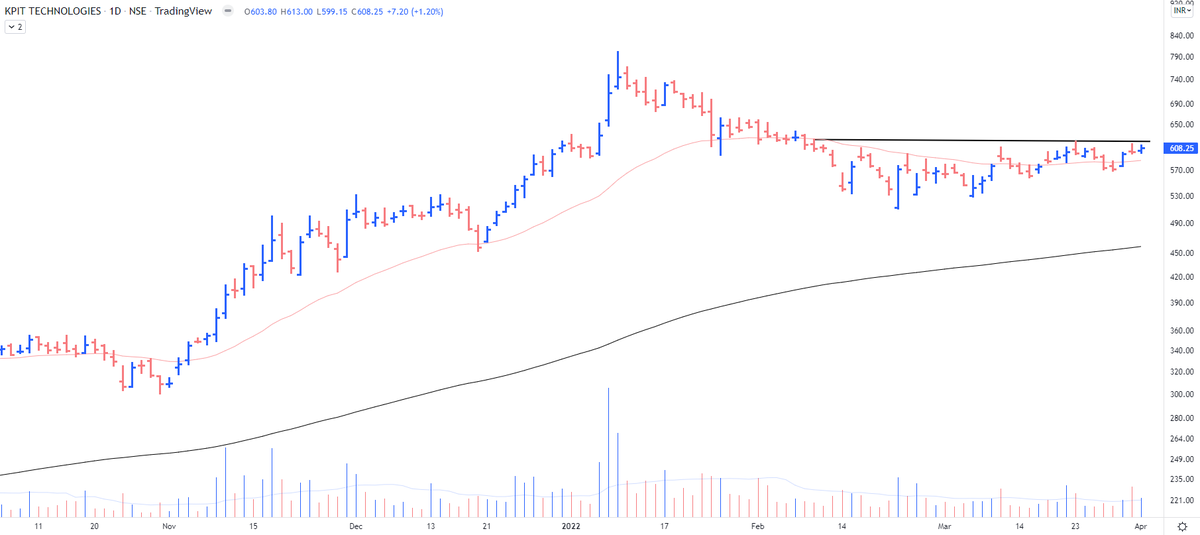
VCP Breakout
High Volumes on Up days
Stock in STage 2 Uptrend
Small Stoploss Trade #kpittech
More from JayneshKasliwal


Detailed Study of Stocks that became 5X in past 2 Years
A Mega Thread🧵
Concepts :
Relative Strength
Stage Analysis
Retweet and Comment If you want a PDF
We have Got around 86 Stocks that became 5X in 2 years
These Belonged to various sectors and Groups
Excel Link for List of Stocks
https://t.co/jESOUMlbpd
( As on 30th March 2022)
[1/n]
All stocks had few things in common :
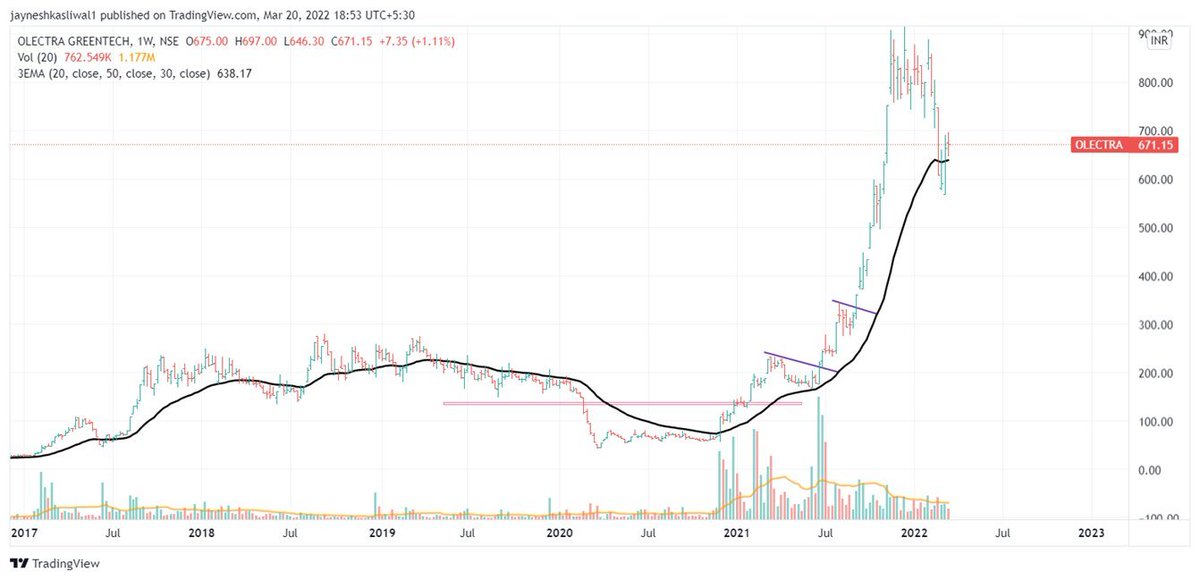
Stocks doubled Before entering into Stage 2 Uptrend
52 week RS was positive in stage 2
90% stocks even gave all time high breakout after Stage 2
60 Stocks had market cap less than 1000 Cr
Examples : OLECTRA , PGEL
[2/n]
So What is Relative Strength ?
Relative strength is a strategy used in momentum investing and in identifying value stocks.
It focuses on investing in stocks or other investments that have performed well relative to the market as a whole or to a relevant benchmark.
[3/n]
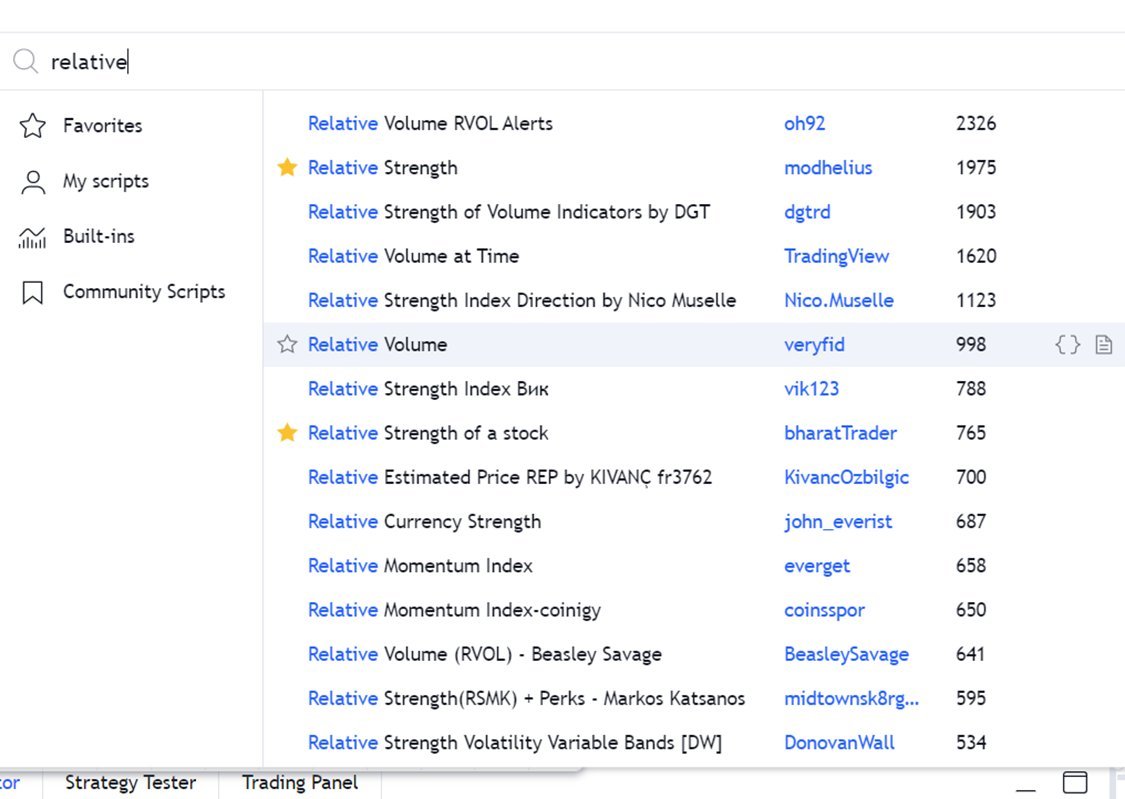
How to Apply ?
Type
“Relative Strength”
Choose any
By bharattrader
By traderlion
By Modhelius
I use by bharattrader
In setting use 52 period
Use Weekly Chart
4/n
A Mega Thread🧵
Concepts :
Relative Strength
Stage Analysis
Retweet and Comment If you want a PDF
We have Got around 86 Stocks that became 5X in 2 years
These Belonged to various sectors and Groups
Excel Link for List of Stocks
https://t.co/jESOUMlbpd
( As on 30th March 2022)
[1/n]
All stocks had few things in common :
Stocks doubled Before entering into Stage 2 Uptrend
52 week RS was positive in stage 2
90% stocks even gave all time high breakout after Stage 2
60 Stocks had market cap less than 1000 Cr
Examples : OLECTRA , PGEL
[2/n]
So What is Relative Strength ?
Relative strength is a strategy used in momentum investing and in identifying value stocks.
It focuses on investing in stocks or other investments that have performed well relative to the market as a whole or to a relevant benchmark.
[3/n]
How to Apply ?
Type
“Relative Strength”
Choose any
By bharattrader
By traderlion
By Modhelius
I use by bharattrader
In setting use 52 period
Use Weekly Chart
4/n
More from Kpittech


KPIT - Stay cautious, I'm not sure any surprise is in store!!
I love this company biz, would accumulate at lower levels
cheers https://t.co/02SWIrNcay
I love this company biz, would accumulate at lower levels
cheers https://t.co/02SWIrNcay
KPIT - Major wave 2 is in progress, will hold it with stop loss 555!!
— Moneyspinners - Work Hard, Dream Big!! (@Jai0409) April 15, 2022
cheers https://t.co/VykwxWxLpb


You May Also Like


1/OK, data mystery time.
This New York Times feature shows China with a Gini Index of less than 30, which would make it more equal than Canada, France, or the Netherlands. https://t.co/g3Sv6DZTDE
That's weird. Income inequality in China is legendary.
Let's check this number.
2/The New York Times cites the World Bank's recent report, "Fair Progress? Economic Mobility across Generations Around the World".
The report is available here:
3/The World Bank report has a graph in which it appears to show the same value for China's Gini - under 0.3.
The graph cites the World Development Indicators as its source for the income inequality data.

4/The World Development Indicators are available at the World Bank's website.
Here's the Gini index: https://t.co/MvylQzpX6A
It looks as if the latest estimate for China's Gini is 42.2.
That estimate is from 2012.
5/A Gini of 42.2 would put China in the same neighborhood as the U.S., whose Gini was estimated at 41 in 2013.
I can't find the <30 number anywhere. The only other estimate in the tables for China is from 2008, when it was estimated at 42.8.
This New York Times feature shows China with a Gini Index of less than 30, which would make it more equal than Canada, France, or the Netherlands. https://t.co/g3Sv6DZTDE
That's weird. Income inequality in China is legendary.
Let's check this number.
2/The New York Times cites the World Bank's recent report, "Fair Progress? Economic Mobility across Generations Around the World".
The report is available here:
3/The World Bank report has a graph in which it appears to show the same value for China's Gini - under 0.3.
The graph cites the World Development Indicators as its source for the income inequality data.
4/The World Development Indicators are available at the World Bank's website.
Here's the Gini index: https://t.co/MvylQzpX6A
It looks as if the latest estimate for China's Gini is 42.2.
That estimate is from 2012.
5/A Gini of 42.2 would put China in the same neighborhood as the U.S., whose Gini was estimated at 41 in 2013.
I can't find the <30 number anywhere. The only other estimate in the tables for China is from 2008, when it was estimated at 42.8.