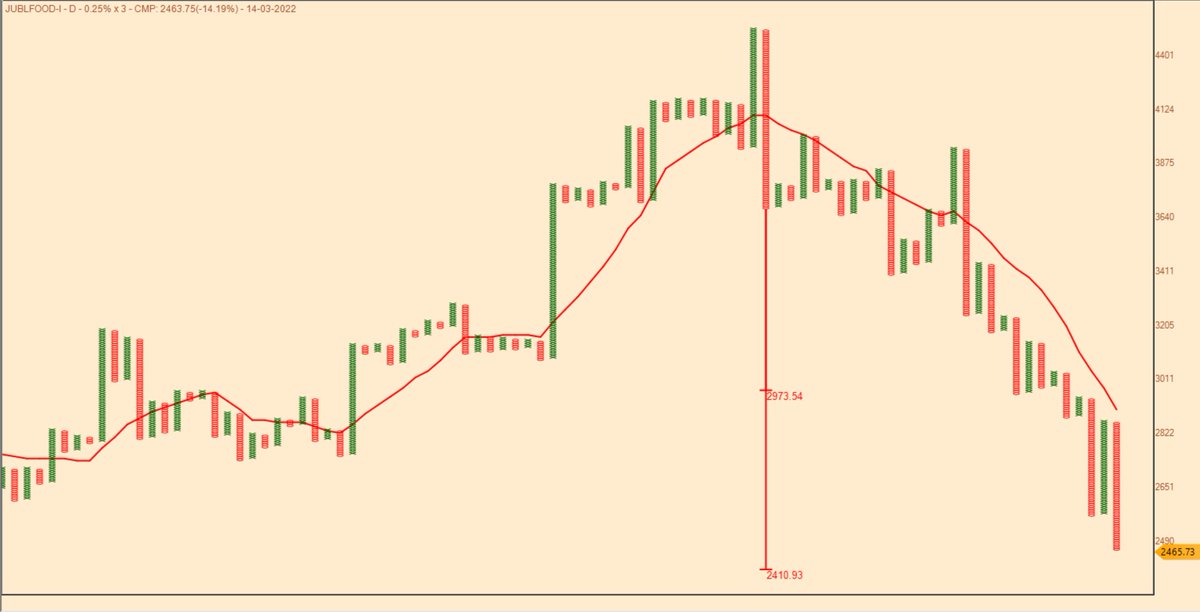
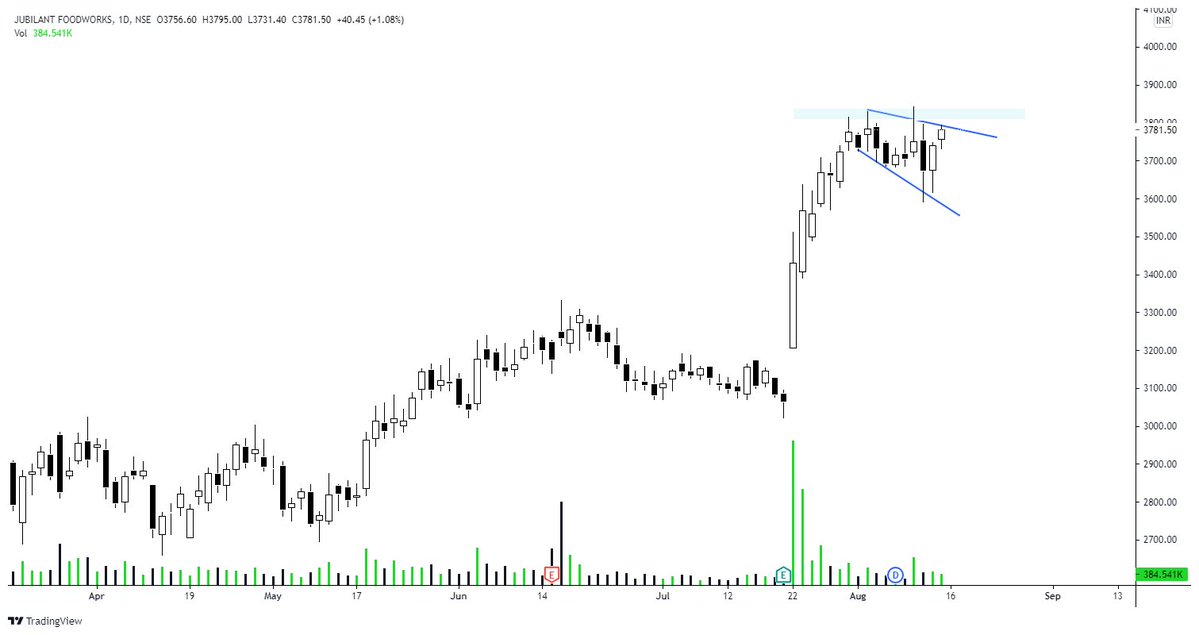
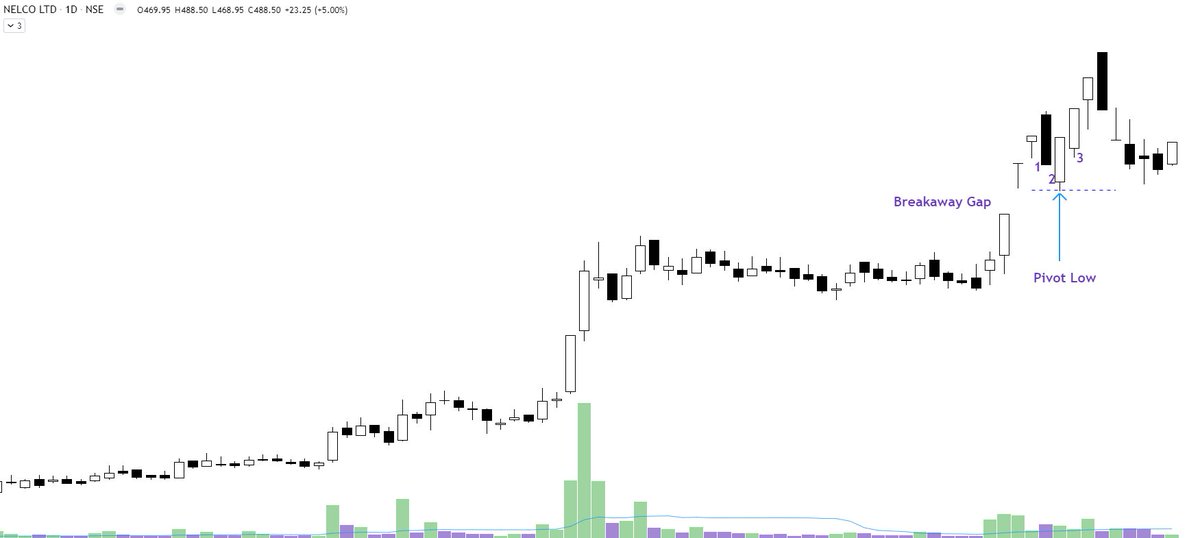
High volumes could have been better here although I am content with the move from the March lows considering the least risk the setup provided. It is better if we get a strong candle closing above the boundary.
Jubilant Foodworks - updated chart https://t.co/mH1TTqHbcq
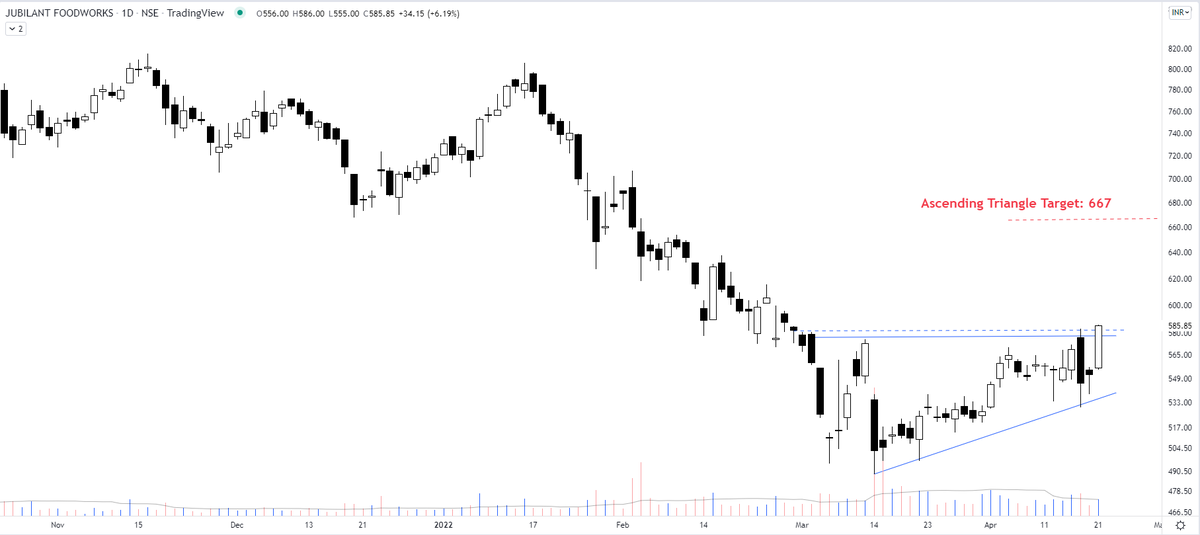
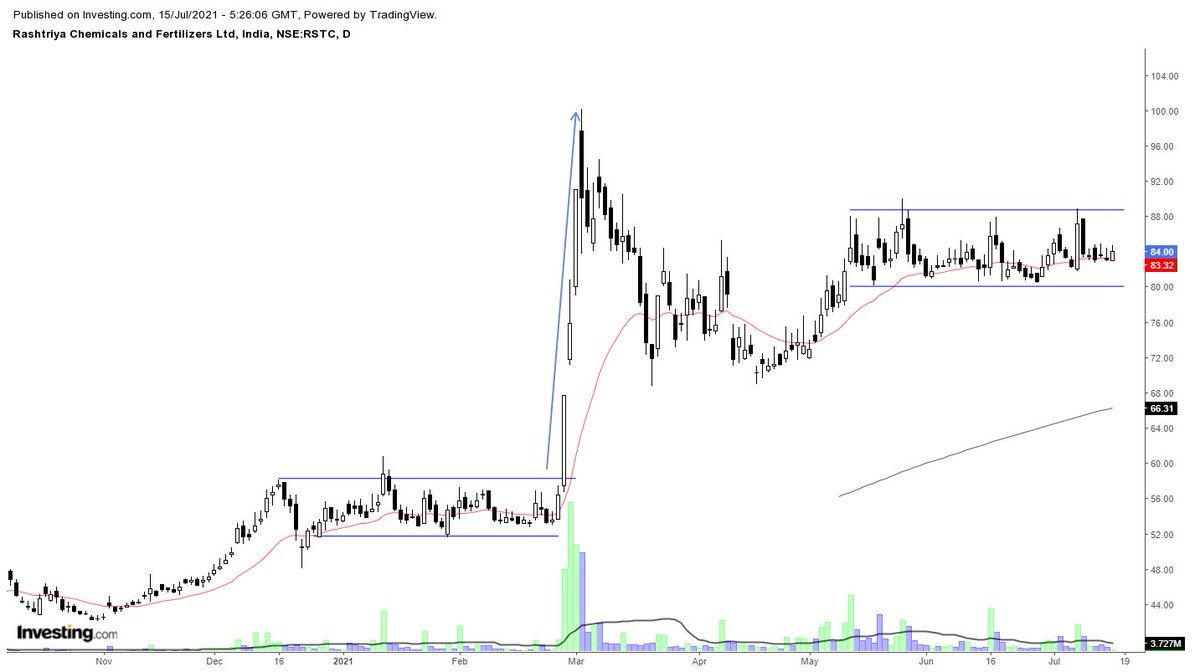
Post the capitulation move, I am anticipating an ascending triangle breakout in Jubilant Foodworks however the buy is not triggered yet. That target open would be 667.
— The_Chartist \U0001f4c8 (@charts_zone) April 21, 2022
Ascending triangles also act as key reversal patterns. https://t.co/M1vLYEsngf pic.twitter.com/f06rbJhLaq
More from The_Chartist 📈

Explained you same concept with Elxsi. The real test of a strong Breakout is that the big hand will not give you another chance to buy the share at the breakout level. They will absorb all the selling of weak hands. I mean "STRONG breakout". https://t.co/7fxFqGQl3p
Tata Elxsi ---
— Steve Nison (@nison_steve) June 30, 2021
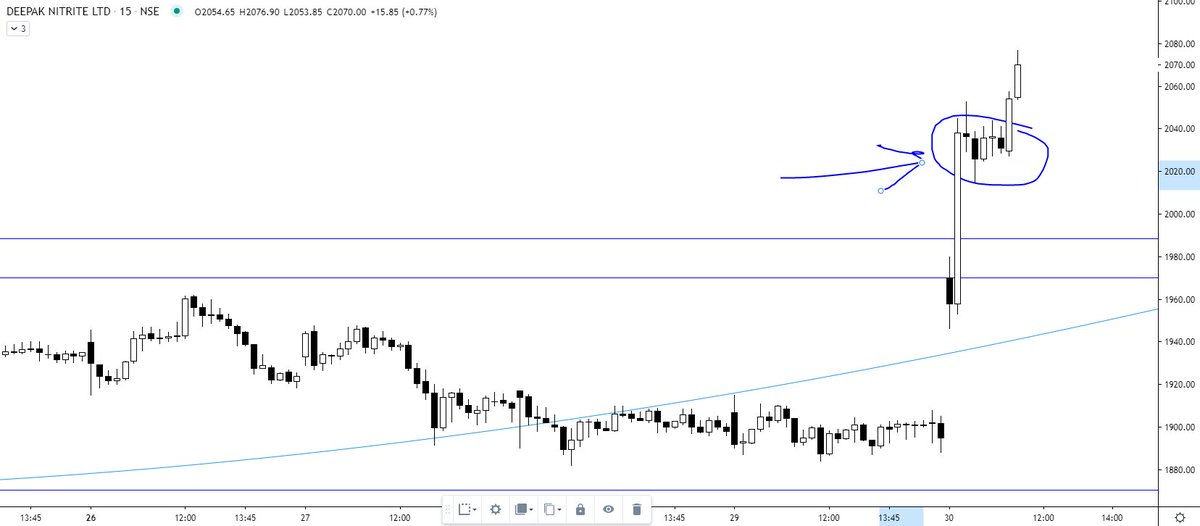
In the last 10 minutes, all the selling was absorbed despite intraday positions being squared off (if not converted). will wait for the EOD data. However, the chart structure is extremely strong. https://t.co/pci7GCDBEO pic.twitter.com/1NBD9V3mKc
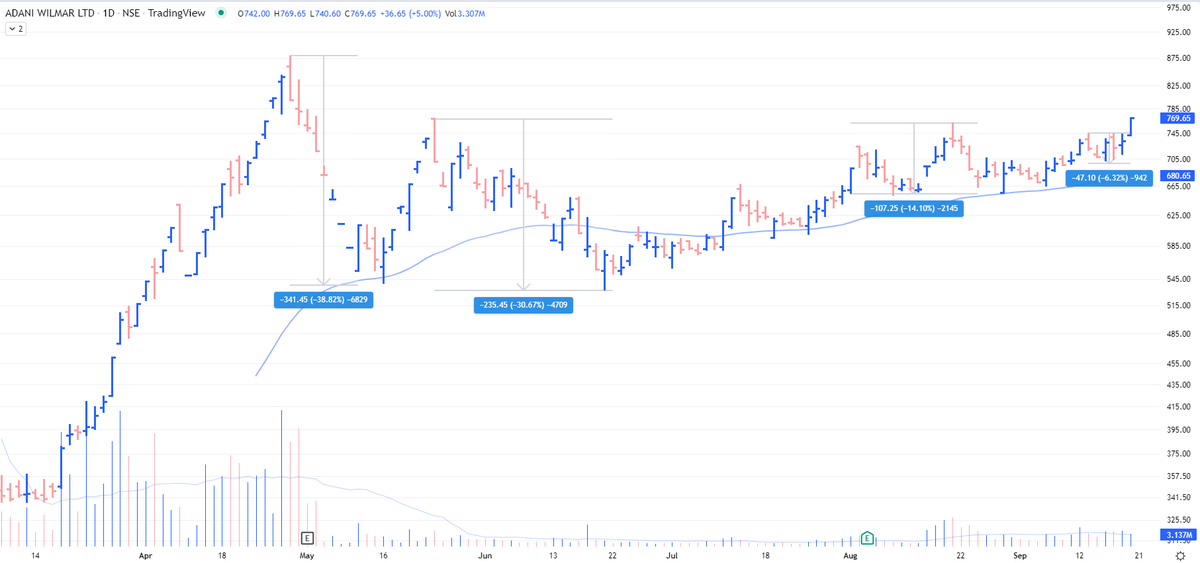
AWL - look at the ranges of contraction on the chart https://t.co/2XMhqZQu8X
Borosil Renewables - Patterns like these must be looked at carefully and must be kept on the radar. Herein price is contracting which generally signifies shifting of hands (from weak to strong). If you go wrong, the risk is limited in these. pic.twitter.com/iqyoeslZjy
— The_Chartist \U0001f4c8 (@charts_zone) July 12, 2021

More from Jublfood

Double Top Buy & T20 Pattern - Bullish above 4058.33 daily close on 1% Box Size chart. https://t.co/DPEehZwkS4
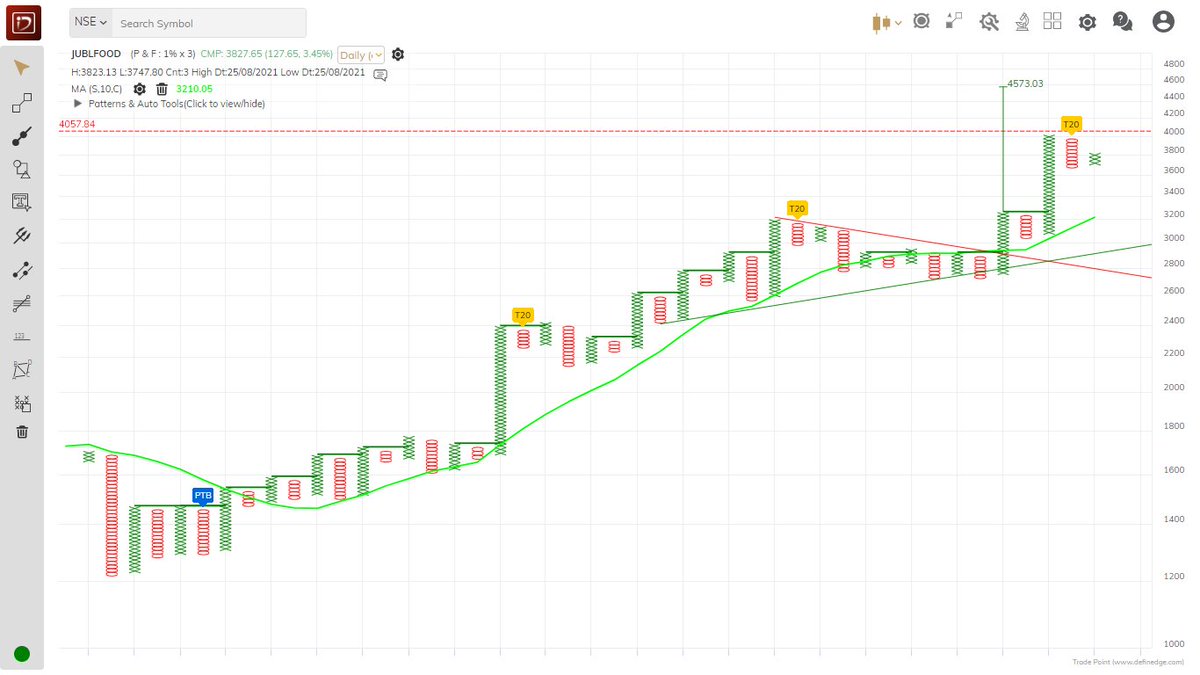
JUBLFOOD
— Saket Reddy (@saketreddy) June 24, 2020
Achieved the second target of 1820 today, now near the first target of 1780!
Got a nice 15-20% move till now.
Trailing stop loss is the best thing one can do now! https://t.co/YidPZamyxz